With September more than half over, it’s time to take a look at the silver market as it's a market on the move.
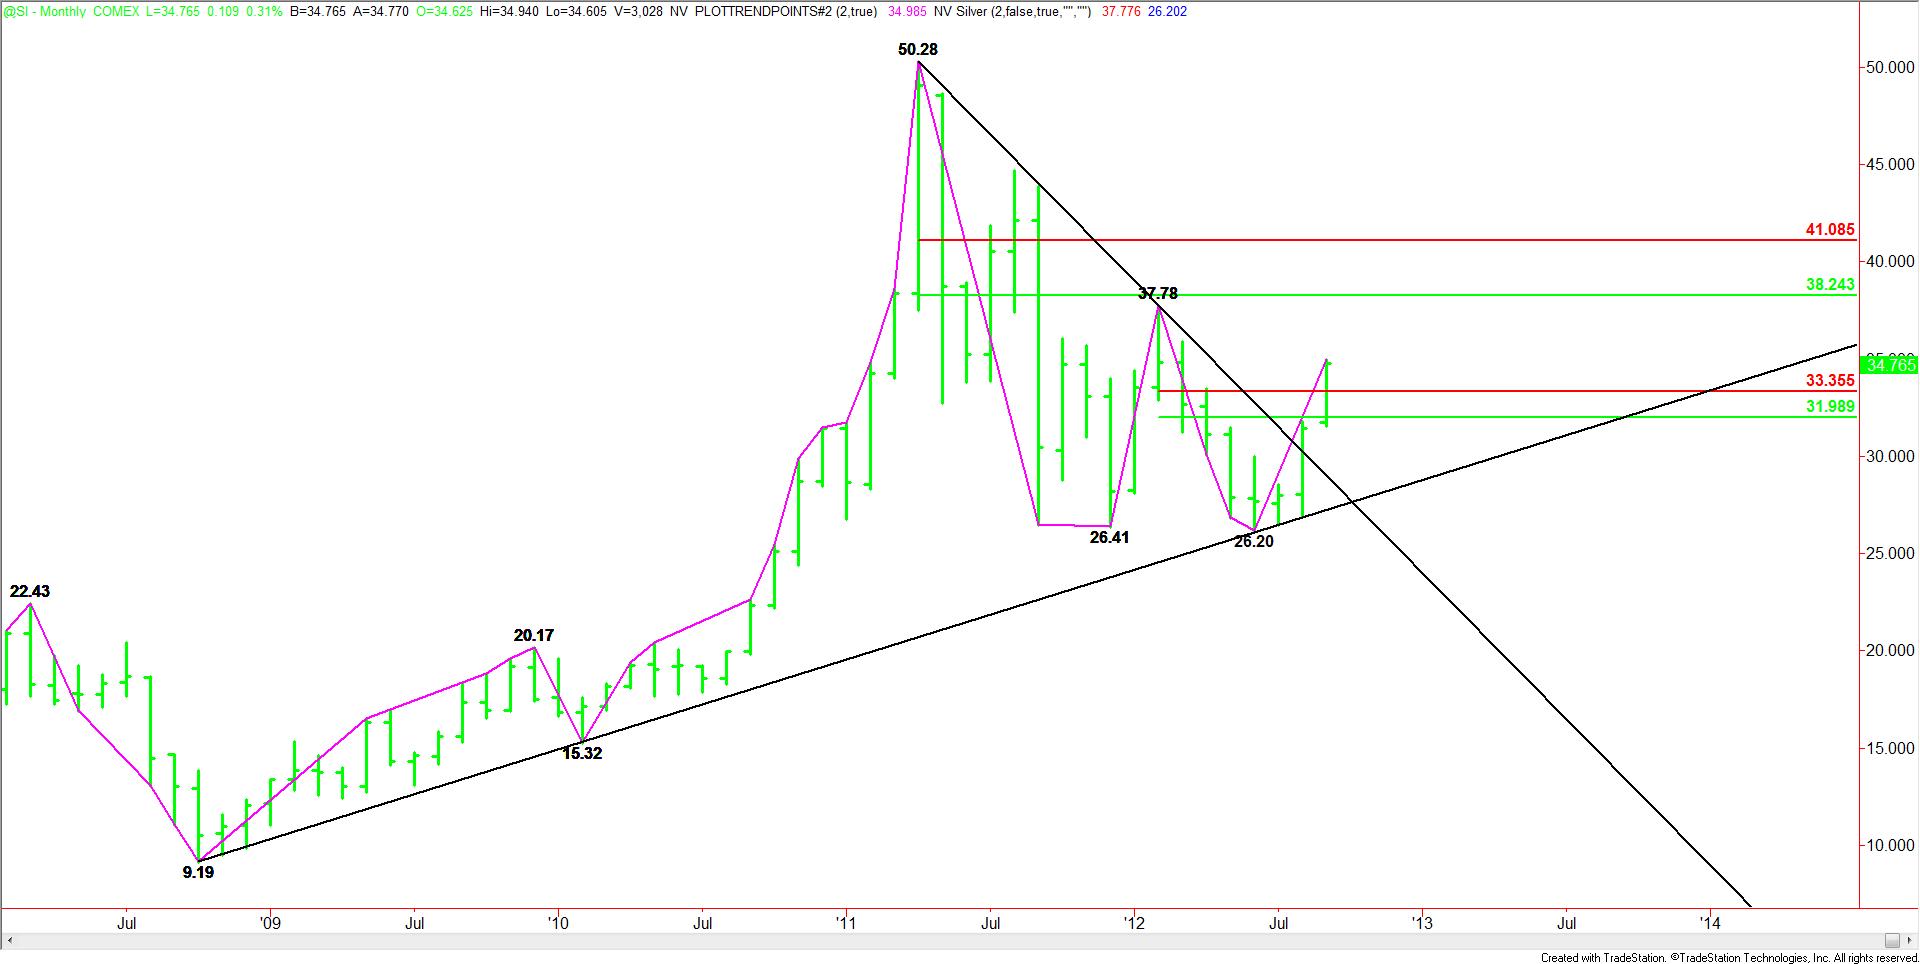
Last month, the Nearby Silver market broke through the resistance line of a triangle chart pattern on the monthly chart. In August, the resistance line was at $30.27 so the close at $31.44 was impressive. Since the market had been in such a severe down trend, the most important part of this chart pattern is the follow-through rally.
With the short-term range $37.78 to $26.20, a key retracement zone was created at $31.99 to $33.35. This area could have become a resistance zone, but strong follow-through momentum triggered a breakout through the retracement zone, putting the market in a position to challenge the February top at $37.78. This zone is now new support.
Look For A Breakout
Besides the clearly formed triangle chart pattern, traders should also notice the developing double-bottom pattern. The two bottoms of the formation are $26.41 and $26.20. A breakout over $37.78 will not only turn the main trend up on the swing chart, but it will also confirm the double-bottom. If you take the difference between $37.78 and $26.20 and add it to $37.78, the projected upside target based on this chart pattern is $49.36. ($37.78 – $26.20 = $11.58. Add $11.58 to $37.78 to get $49.36).A move to this this level will put it slightly below the April 2011 top at $50.28.
Using previous rallies as our guide, traders should not expect a fast rally into this level. The course it is expected to take should be steady at least until it clears the retracement zone created by the $50.28 to $26.20 range at $38.24 to $41.08. In 2011, following a steady rally, the silver market went vertical as it passed through this same price area. I’m not saying this could happen again, but just referring to the past. Slow and steady may lead to higher prices over the long-run whereas vertical moves may spell the end to the run. Only time will tell if speculators have learned any lessons from the past.
- English (UK)
- English (India)
- English (Canada)
- English (Australia)
- English (South Africa)
- English (Philippines)
- English (Nigeria)
- Deutsch
- Español (España)
- Español (México)
- Français
- Italiano
- Nederlands
- Português (Portugal)
- Polski
- Português (Brasil)
- Русский
- Türkçe
- العربية
- Ελληνικά
- Svenska
- Suomi
- עברית
- 日本語
- 한국어
- 简体中文
- 繁體中文
- Bahasa Indonesia
- Bahasa Melayu
- ไทย
- Tiếng Việt
- हिंदी
Monthly Nearby Silver Nearing Breakout
Published 09/17/2012, 03:00 PM
Updated 05/14/2017, 06:45 AM
Monthly Nearby Silver Nearing Breakout
Latest comments
Loading next article…
Install Our App
Risk Disclosure: Trading in financial instruments and/or cryptocurrencies involves high risks including the risk of losing some, or all, of your investment amount, and may not be suitable for all investors. Prices of cryptocurrencies are extremely volatile and may be affected by external factors such as financial, regulatory or political events. Trading on margin increases the financial risks.
Before deciding to trade in financial instrument or cryptocurrencies you should be fully informed of the risks and costs associated with trading the financial markets, carefully consider your investment objectives, level of experience, and risk appetite, and seek professional advice where needed.
Fusion Media would like to remind you that the data contained in this website is not necessarily real-time nor accurate. The data and prices on the website are not necessarily provided by any market or exchange, but may be provided by market makers, and so prices may not be accurate and may differ from the actual price at any given market, meaning prices are indicative and not appropriate for trading purposes. Fusion Media and any provider of the data contained in this website will not accept liability for any loss or damage as a result of your trading, or your reliance on the information contained within this website.
It is prohibited to use, store, reproduce, display, modify, transmit or distribute the data contained in this website without the explicit prior written permission of Fusion Media and/or the data provider. All intellectual property rights are reserved by the providers and/or the exchange providing the data contained in this website.
Fusion Media may be compensated by the advertisers that appear on the website, based on your interaction with the advertisements or advertisers.
© 2007-2025 - Fusion Media Limited. All Rights Reserved.
