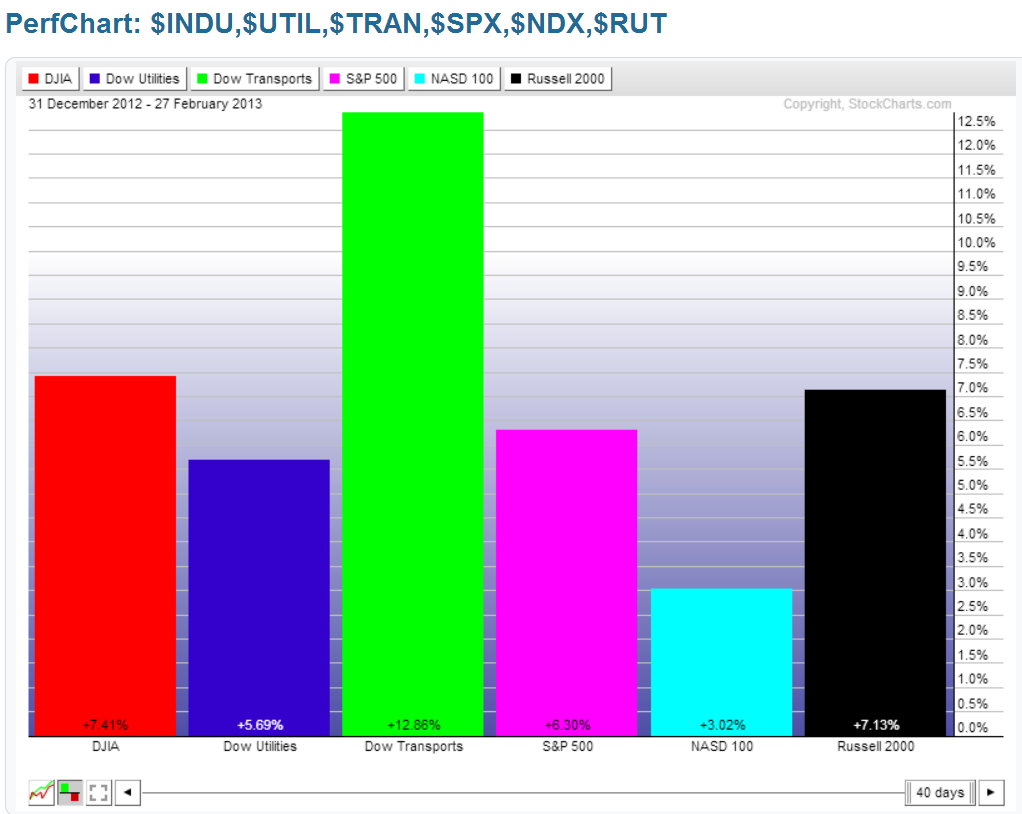
The first percentage gained/lost graph below shows gains made, so far, in 2013 for the Major Indices. The Dow Transports leads in gains with nearly 13%, the Dow 30 and Russell 2000 are closely tied for second place, followed by the S&P 500, Dow Utilities, and Nasdaq 100.

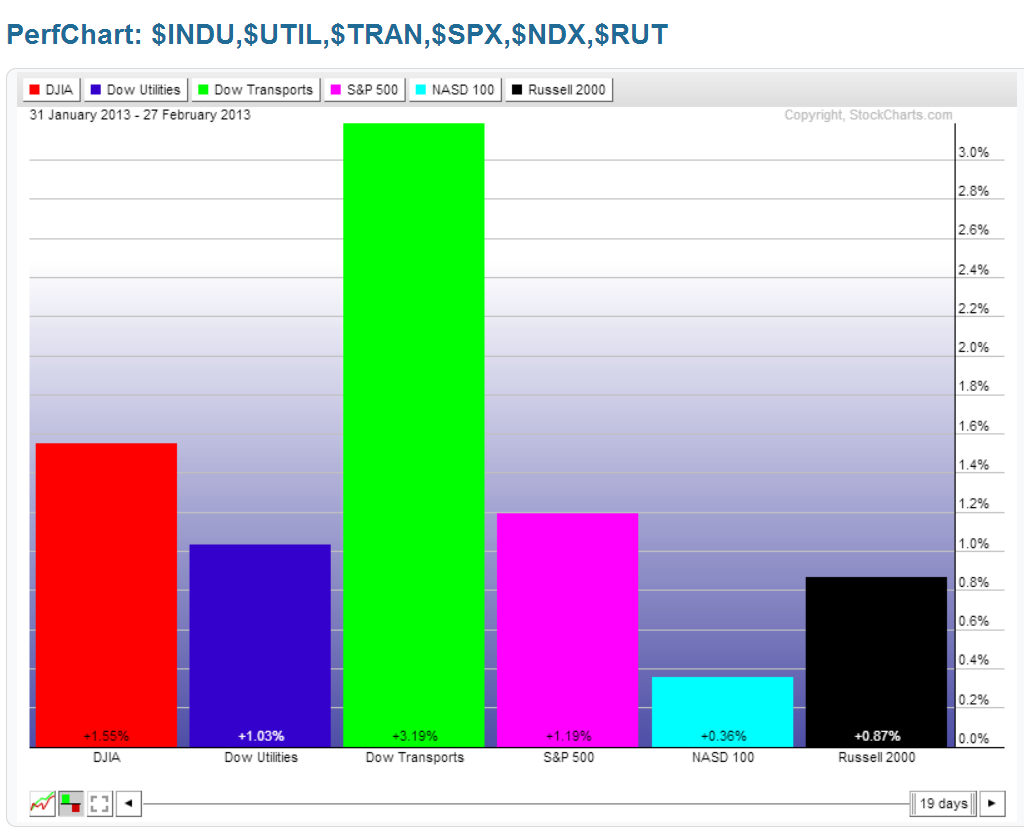
The second percentage gained/lost graph shows gains made for only the month of February until Wednesday's close. The Dow Transports has been the leader this month, while the Dow 30, S&P 500, and Dow Utilities all outperformed the Russell 2000. The Nasdaq is only slightly above break-even.

This tells me that market participants have recently been favouring large-cap, more defensive, stocks over riskier, high-beta small-cap and tech stocks, as they have been grinding higher toward their all-time high levels. I'll be watching to see if money begins to start flowing into small-cap and tech stocks any time soon to signal that the markets are willing to take on more risk that may be needed to push all of the Major Indices to new all-time highs and sustain that kind of momentum going forward for the balance of the year. Otherwise, we could see some serious profit-taking and pullback begin in the not-too-distant future in all Indices.

The second percentage gained/lost graph shows gains made for only the month of February until Wednesday's close. The Dow Transports has been the leader this month, while the Dow 30, S&P 500, and Dow Utilities all outperformed the Russell 2000. The Nasdaq is only slightly above break-even.

This tells me that market participants have recently been favouring large-cap, more defensive, stocks over riskier, high-beta small-cap and tech stocks, as they have been grinding higher toward their all-time high levels. I'll be watching to see if money begins to start flowing into small-cap and tech stocks any time soon to signal that the markets are willing to take on more risk that may be needed to push all of the Major Indices to new all-time highs and sustain that kind of momentum going forward for the balance of the year. Otherwise, we could see some serious profit-taking and pullback begin in the not-too-distant future in all Indices.
