Further to my last Weekly Market Update, this week's update will look at:
- 6 Major Indices
- 9 Major Sectors
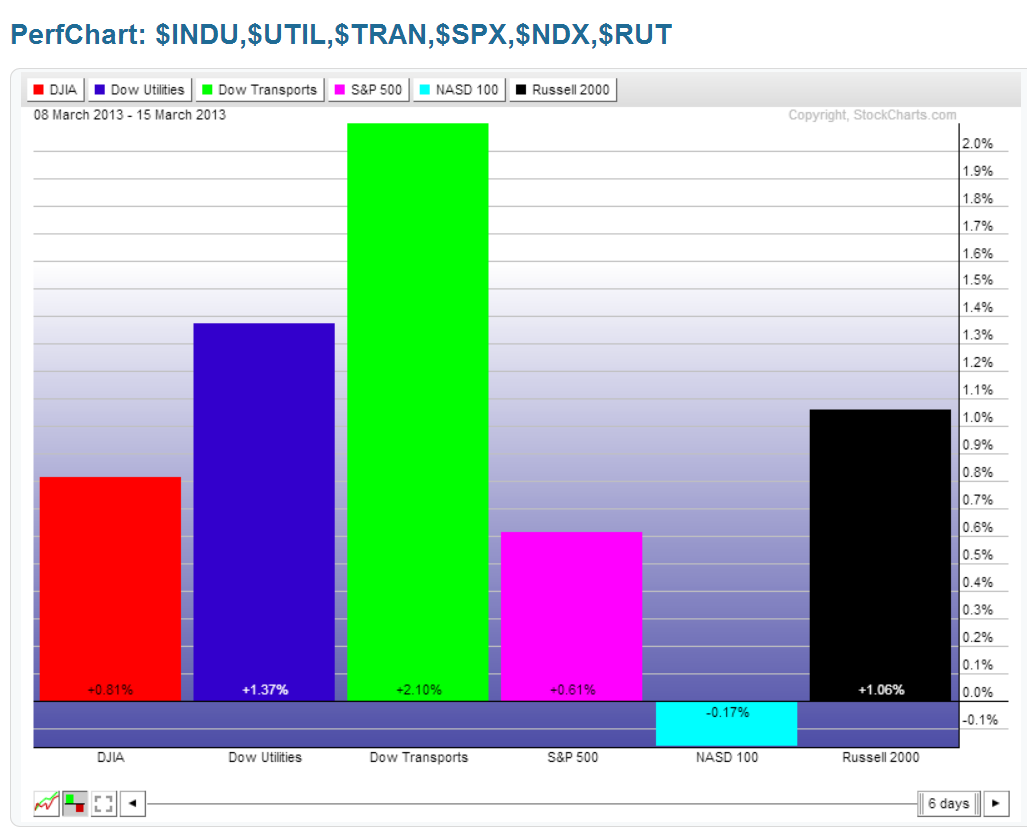
As shown on the Weekly charts and the percentage gained/lost graph below of the Major Indices, the largest gains were made this past week by the Dow Transports, followed by the Dow Utilities, the Russell 2000, the Dow 30, and the S&P 500. Only the Nasdaq 100 ended with a minor loss.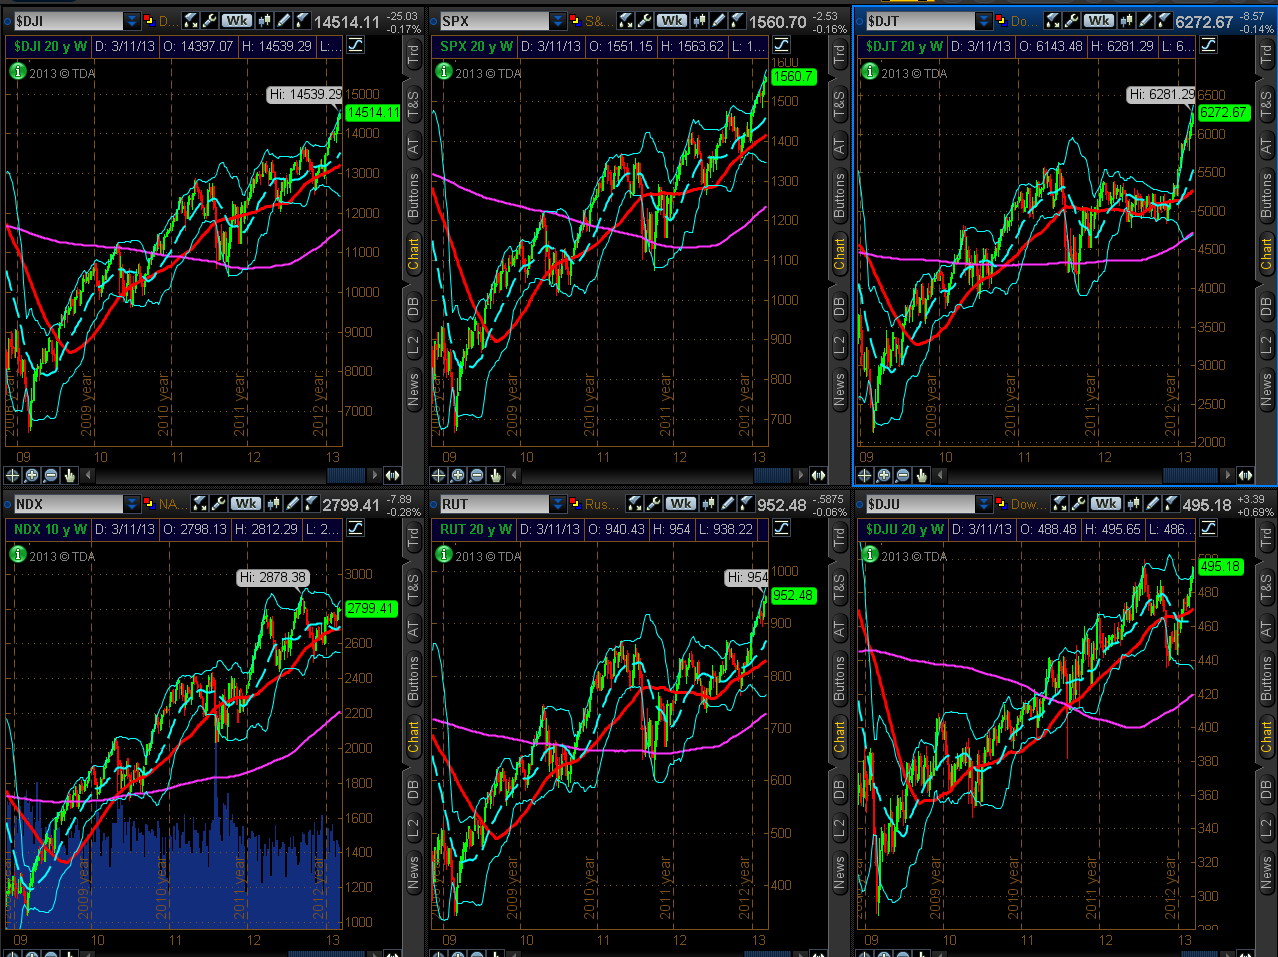
9 Major Sectors
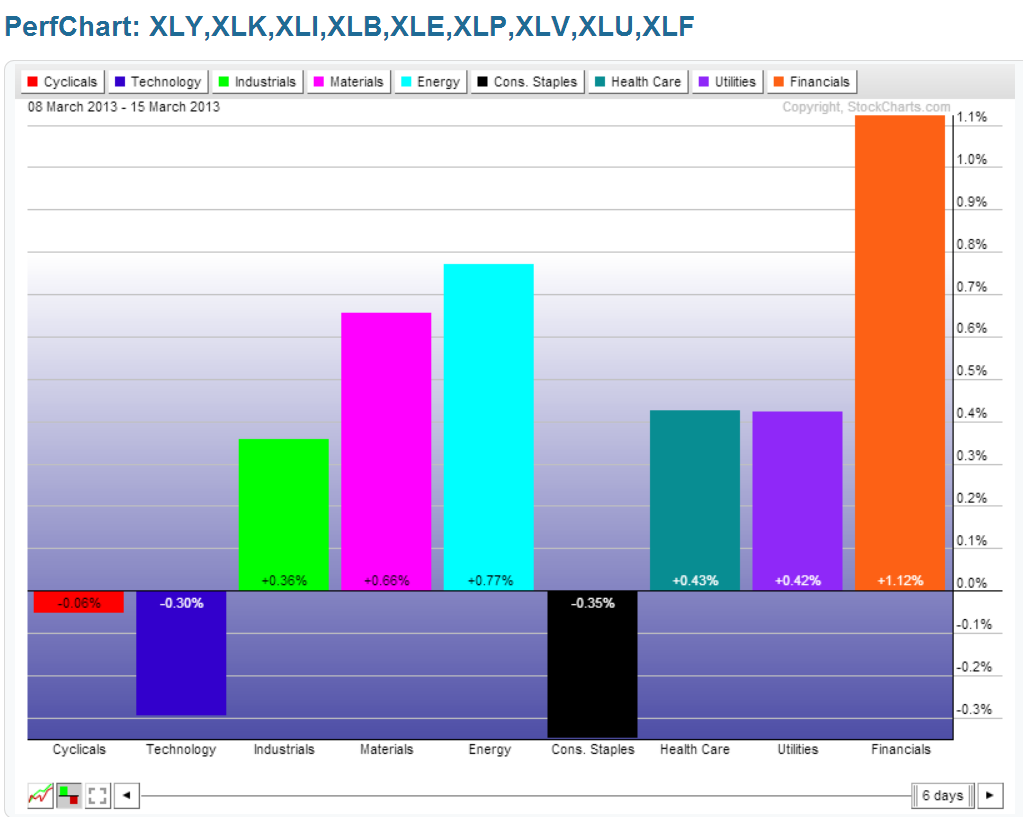
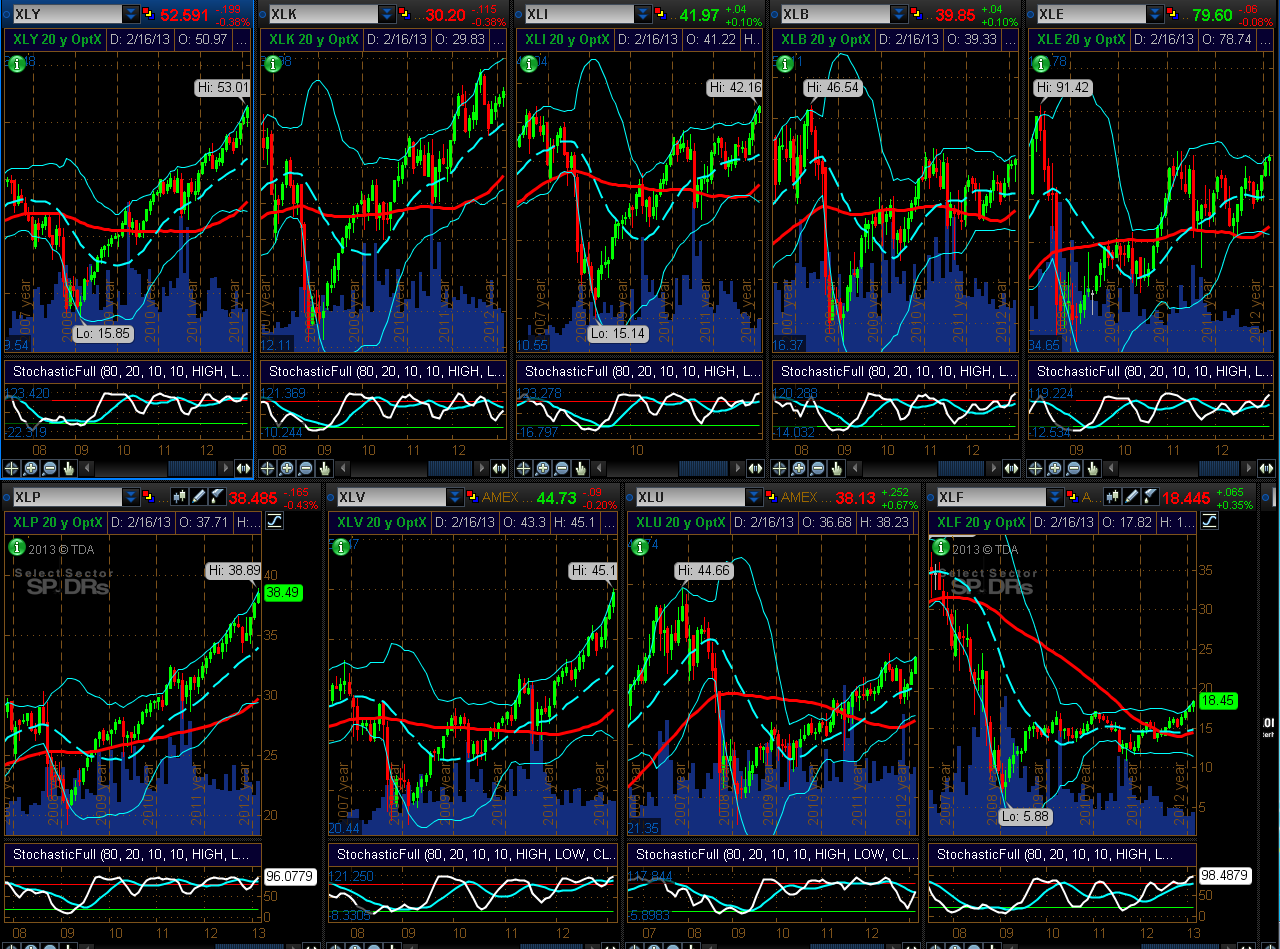
As shown on the Weekly charts and the percentage gained/lost graph below of the Major Sectors, the largest gains were made in the Financials sector, followed by Energy, Materials, Health Care, Utilities, and Industrials. Cyclicals were flat, while Technology and Consumer Staples sustained some losses.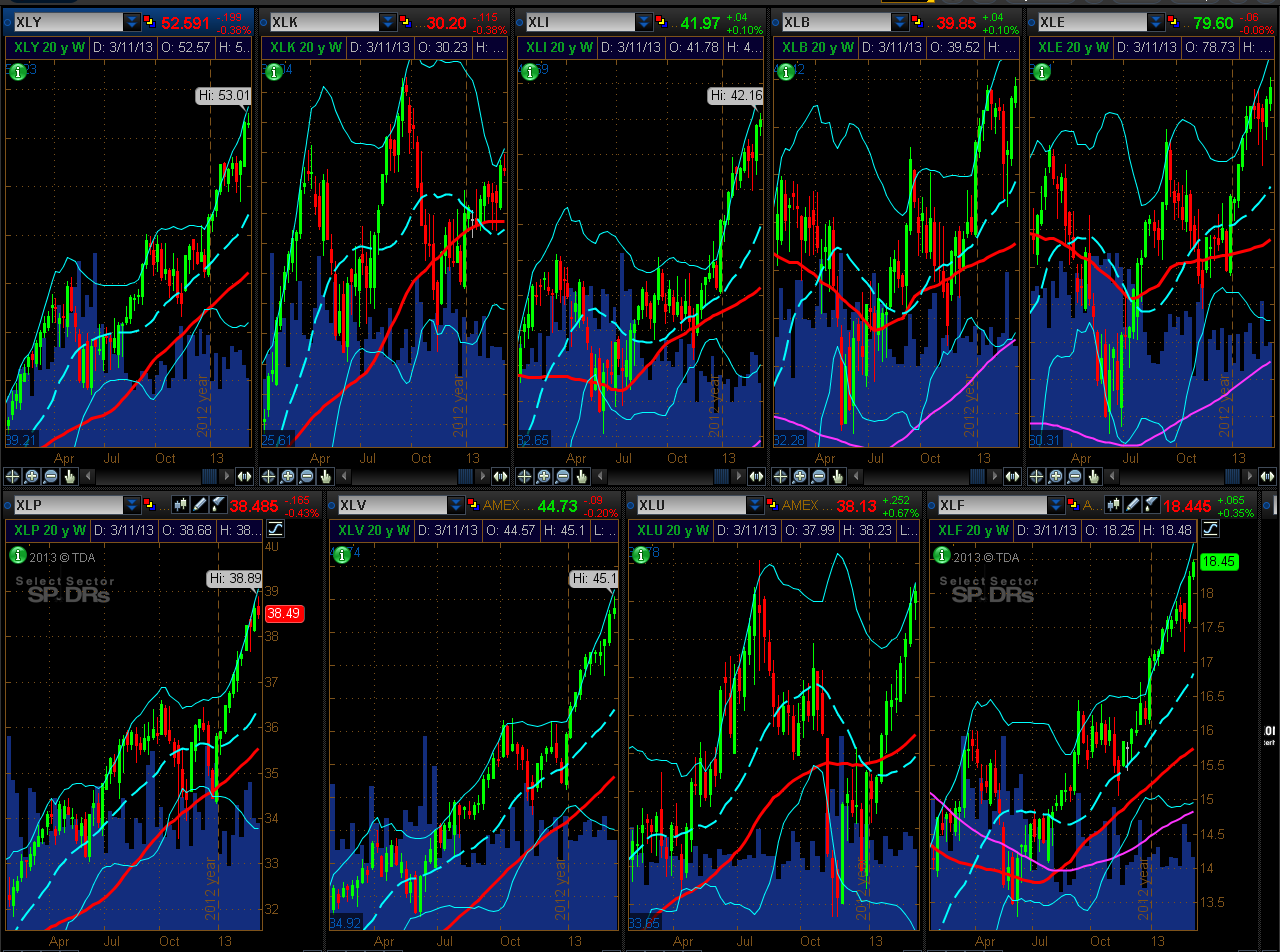
I've added two more chartgrids to this week's review. Each candle shown on the following charts of the Major Indices and Major Sectors represents a 1-month options expiration period. The current candle closed on Friday as part of that day's Quadruple Options Witching operation.
You can see that, with the exception of Technology and Utilities, all of them are well into overbought territory on this time period.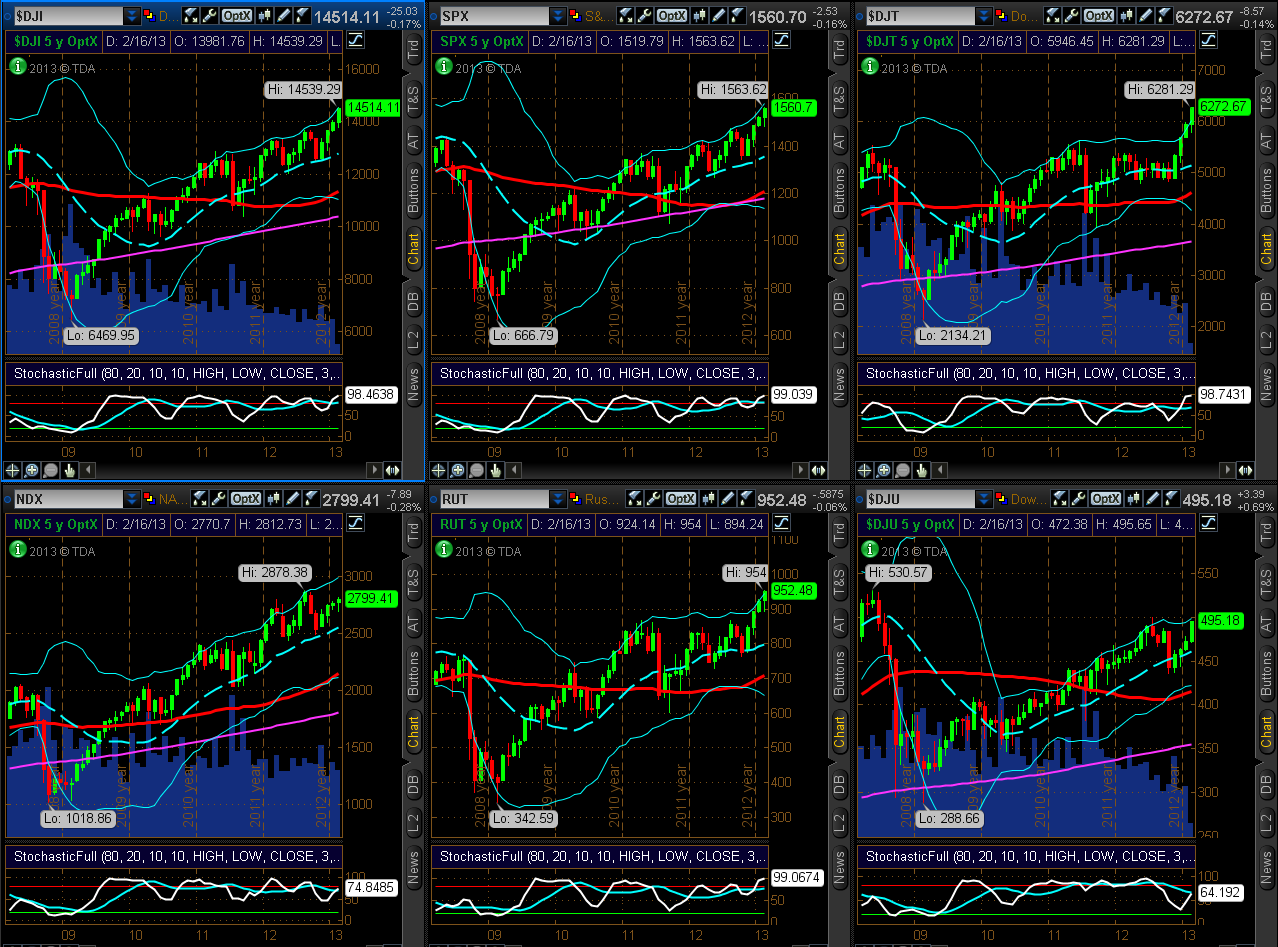
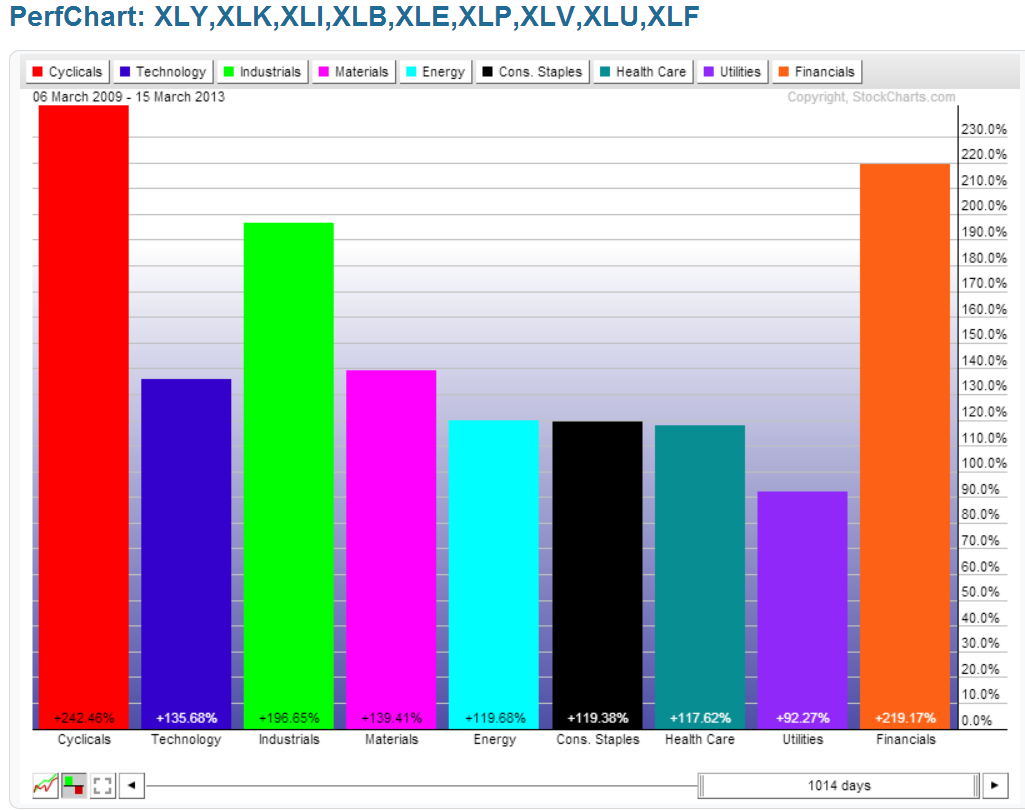
The next two charts show the percentage gained for the Major Indices and the Major Sectors from the March 6, 2009 lows to Friday's close.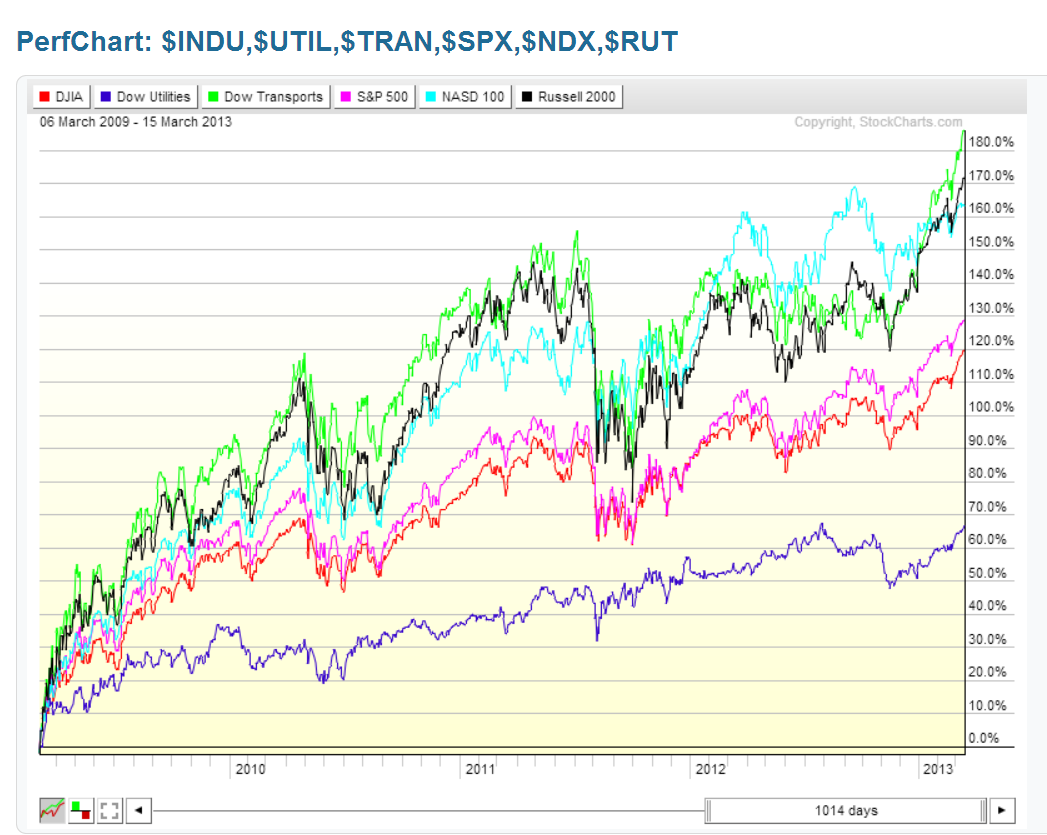
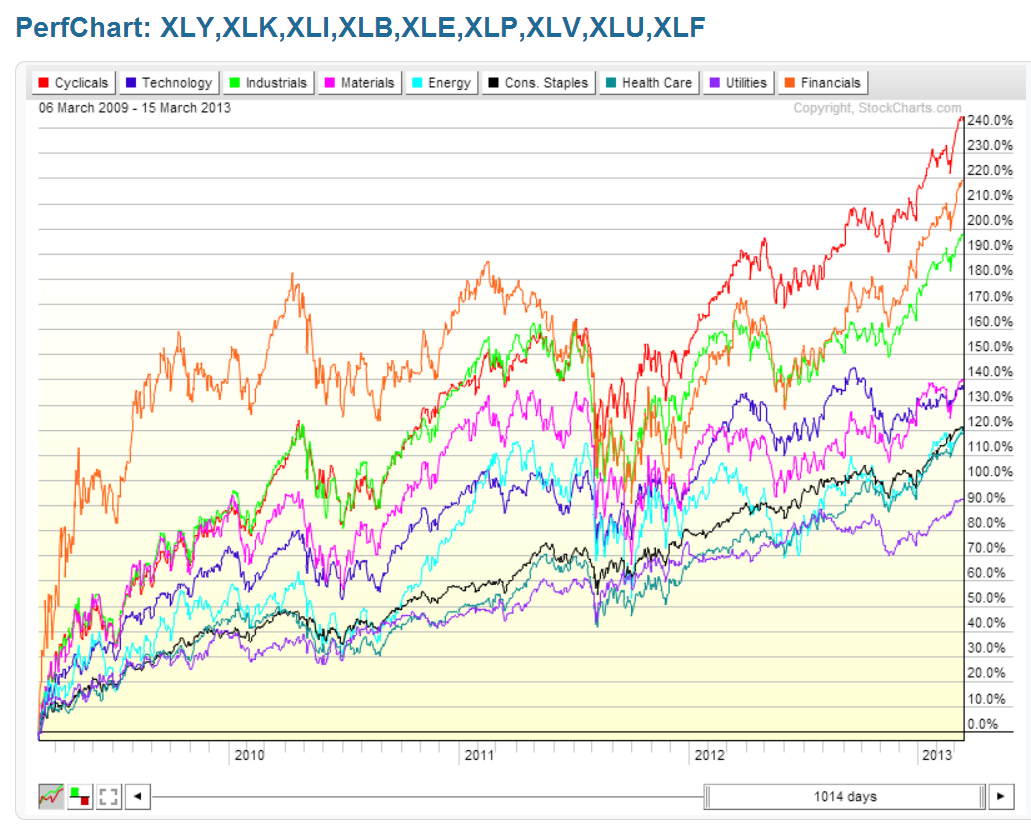
It's easier to see these gains presented in graph format, as shown below.
The Index leaders from the lows of the financial crisis to date have been the Dow Transports, Nasdaq 100, and the Russell 2000.
The Sector leaders have been the Cyclicals, Financials, Industrials, Materials, and Technology.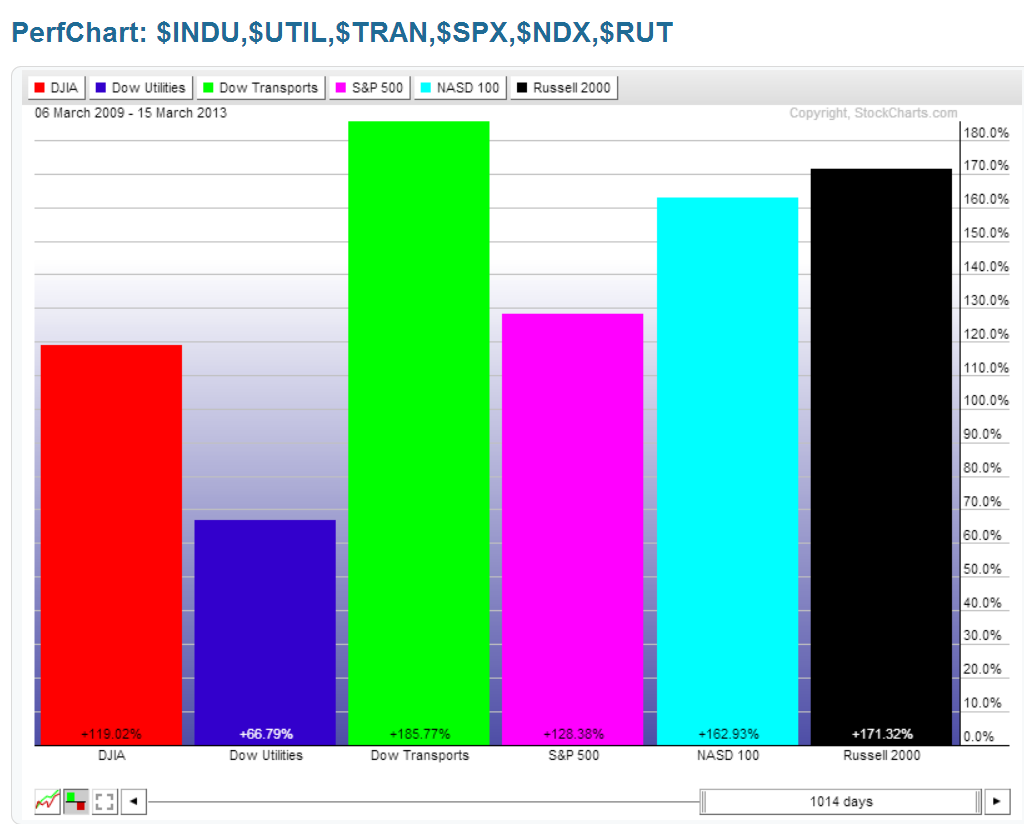
I was reminded of the "pigs wearing lipstick" expression earlier today while watching a piece on TV about product branding. I suppose branding can be applied to almost anything, including stocks and sectors.
In view of what I wrote about earlier this week here, here, and here, I'm left wondering, "Whose lipstick is looking a little too garish and applied with a heavy hand here, dahlink? And, can they withstand more gorging and another whirlwind dance at the ball without applying yet another coat of paint and risk tripping over their tutu?" I'll let each one of you decide for yourself and declare it in the marketplace.
No doubt market participants will be following the results of the next FOMC meeting on March 19/20th (NOTE: the results and forecasts are being released on March 20th at 2:00 pm EST and will be followed by Chairman Bernanke's press conference at 2:30 pm EST).
As well, I'll be watching to see if the Russell 2000 E-mini Futures Index (TF) makes it to 970 by April Fool's Day, as I wrote about here, and to see whether the SPX matches or exceeds its all-time high of 1576.09 any time this coming week.
I'll keep this weekly review (uncharacteristically for me) short and simple and will leave you with a wish for a Happy St. Patrick's Day this Sunday and for prosperity for the coming week.
