The markets have lost much of their glossy sparkle during the past one-year period, both globally and in the U.S, and are in need of a major "touchup."
Further to my last weekly market update, this week's update will take a look at global and domestic markets to assess strength vs. weakness in each group during the past one-year period, as well as the past week.
Below are a series of one-year Daily charts, graphs depicting money flow for a one-year period, as well as graphs depicting money flow for the past week, together with general commentary on each grouping.
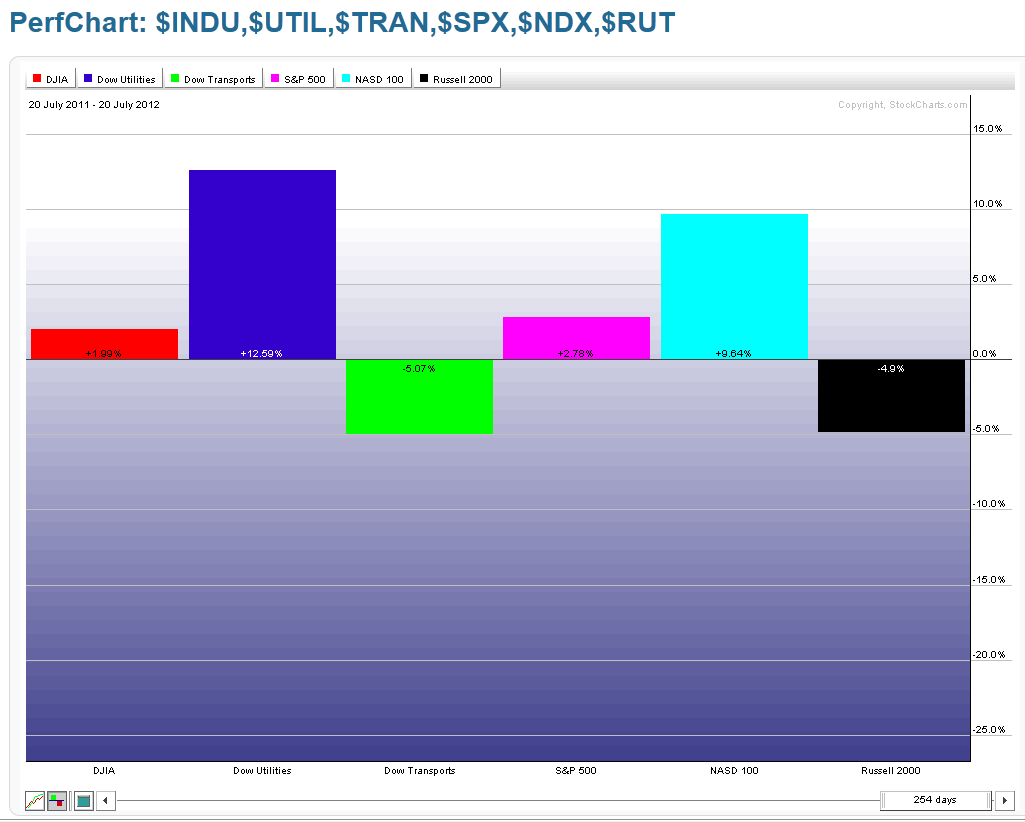
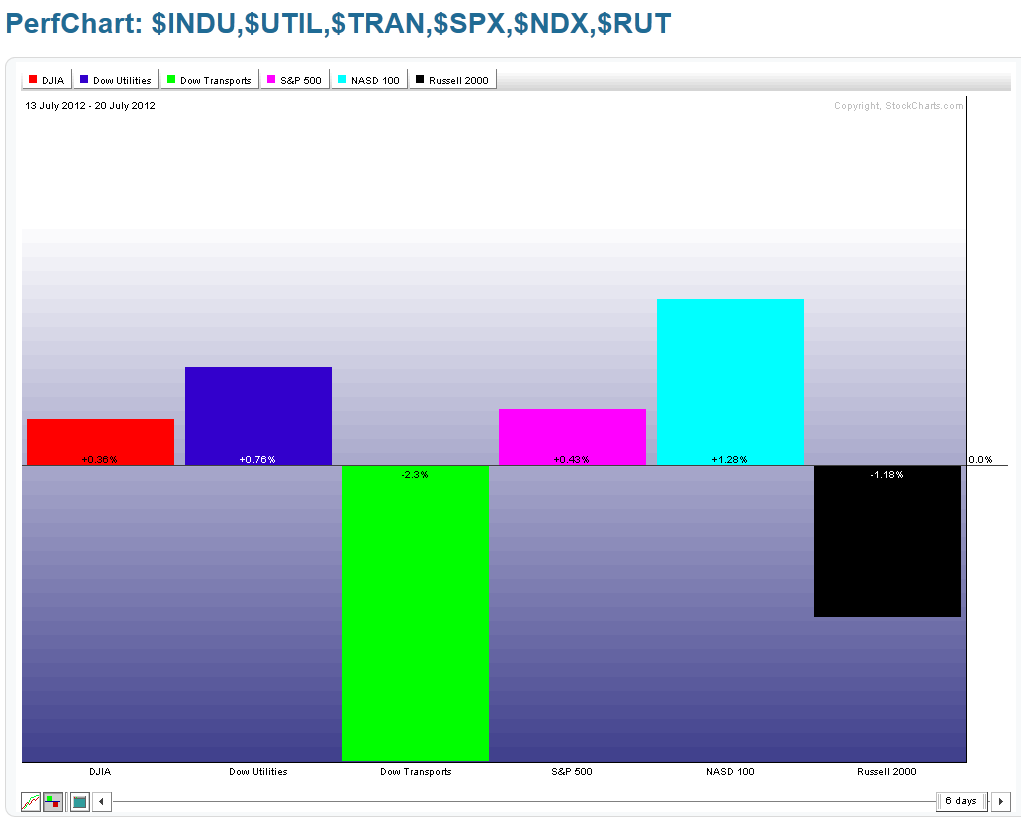
Group 1 features the U.S. Major Indices. You can see from the chart and the first graph that the Utilities Index is leading in strength for the one-year period, while the Nasdaq 100 Index took over the lead during this past week. The laggards for the year, and for the past week, are the Russell 2000 and Dow Transports Indices.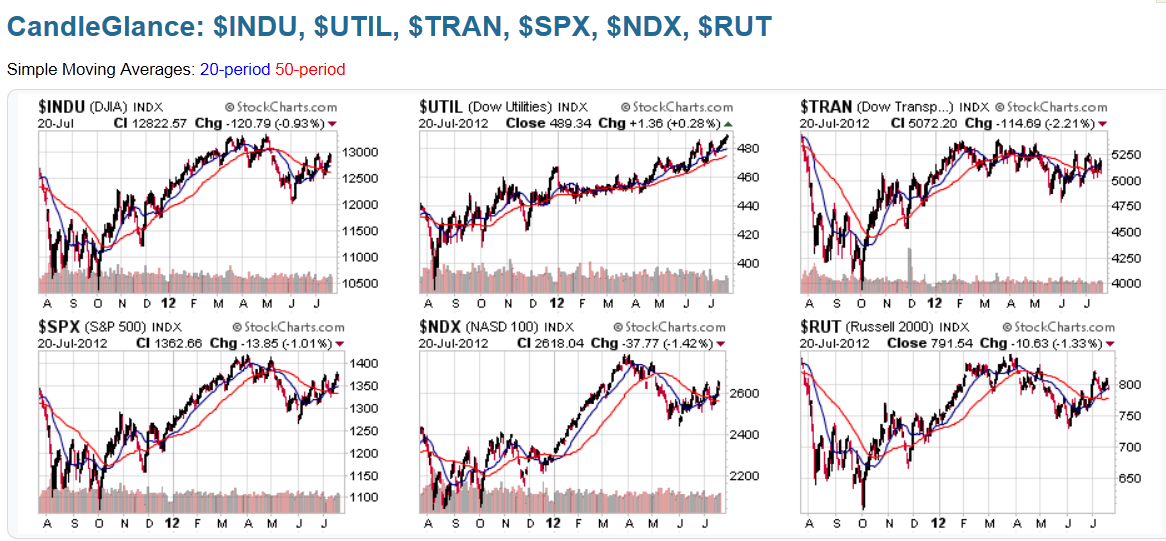
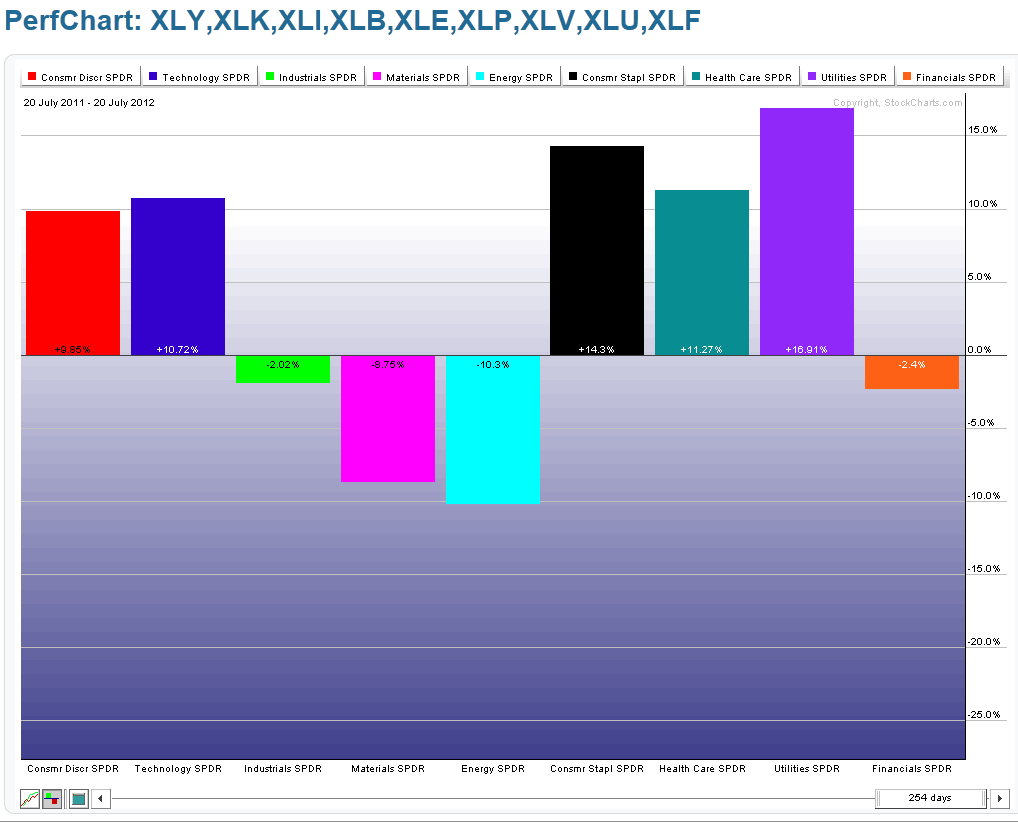
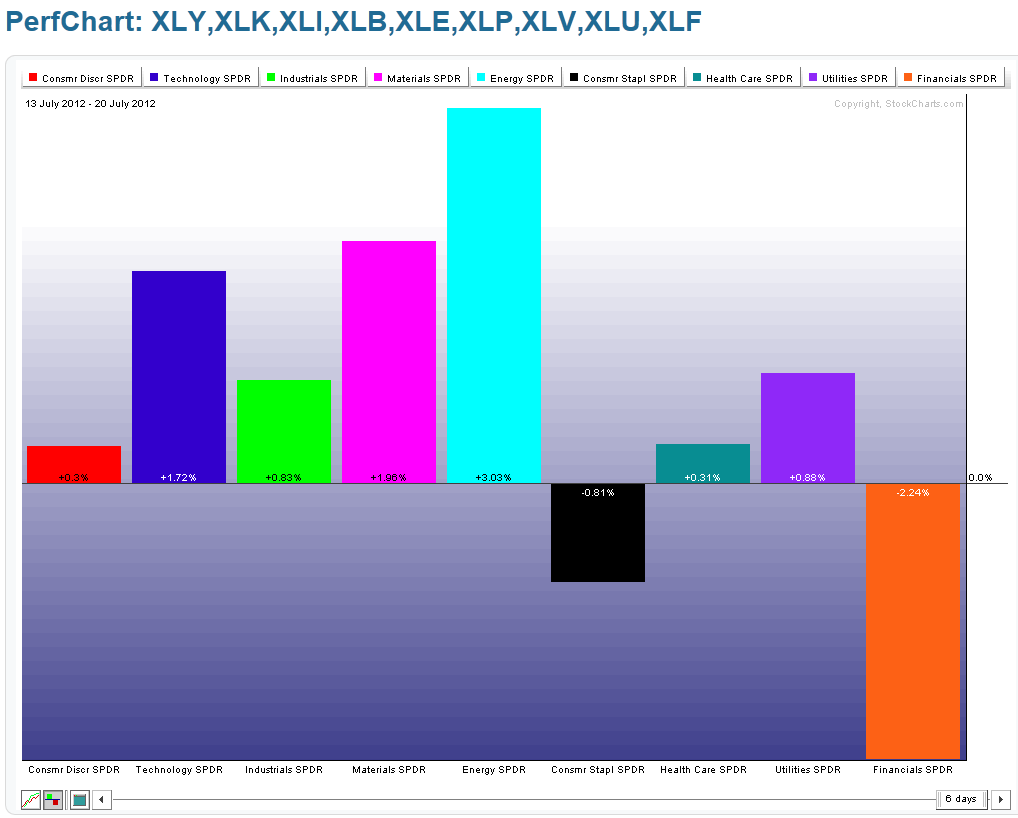
Group 2 features the 9 U.S. Major Sectors. The overall Sector leaders for the one-year period are Utilities, Consumer Staples, and Health Care (the defensive sectors), while Energy, Materials, and Technology gained the most during the past week. The laggards for the year are Financials, Energy, Materials, and Industrials...and for the week are Financials and Consumer Staples.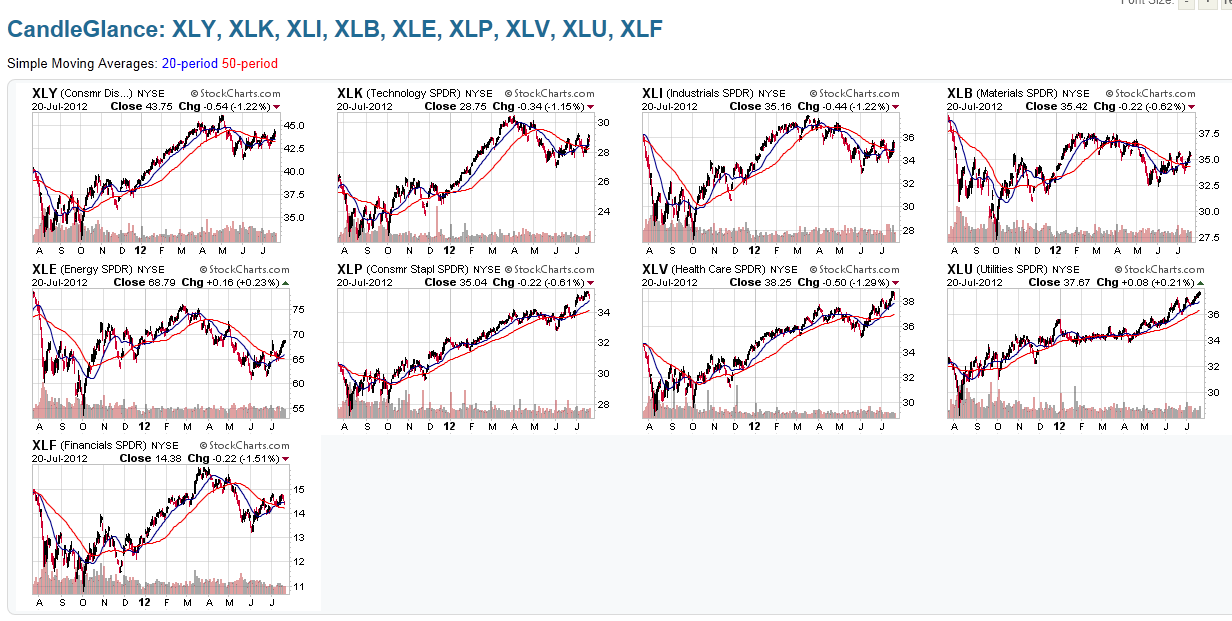
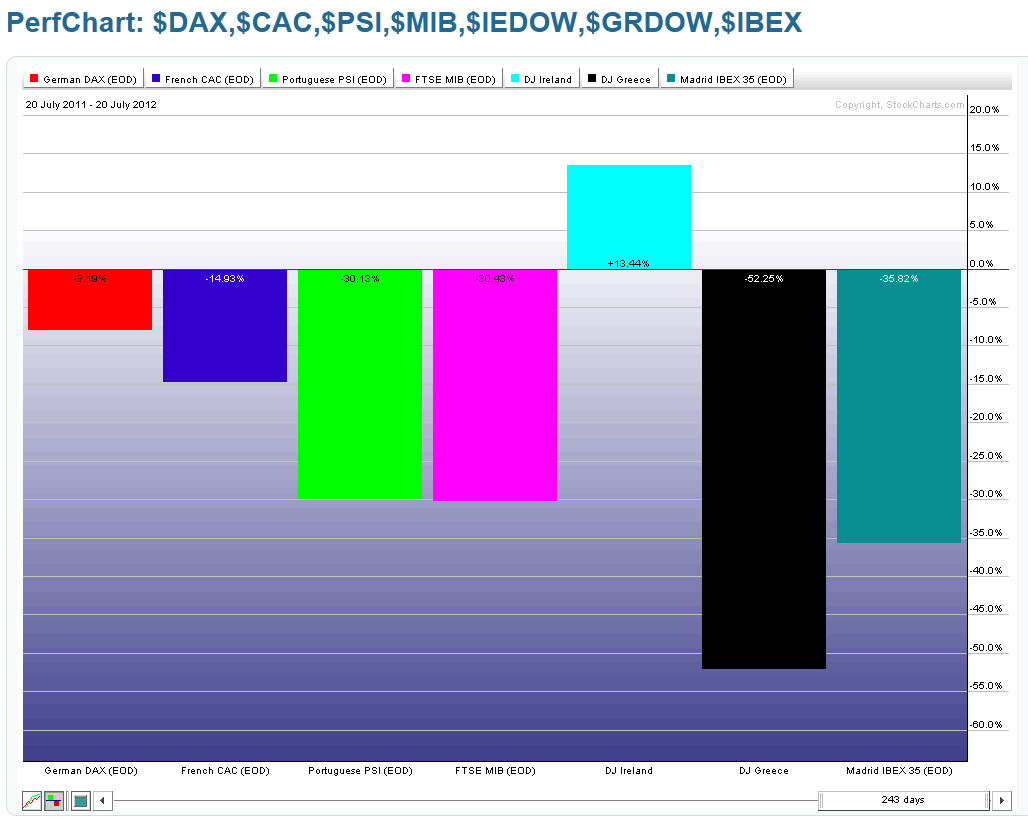
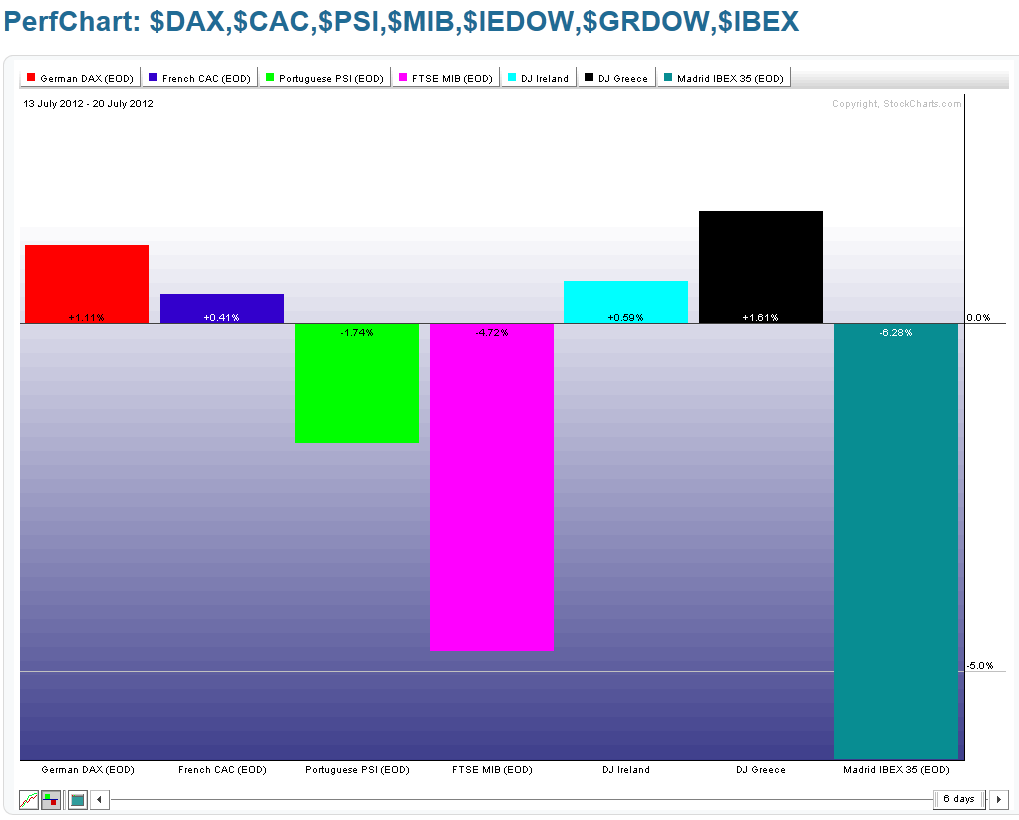
Group 3 features Germany and France, as well as the PIIGS countries (Portugal, Italy, Ireland, Greece, and Spain). The only country to have gained during the one-year period is Ireland, while there were some minor gains in Greece, Germany, Ireland, and France during the past week. The biggest loser during the past year is Greece, followed by Spain, Italy, Portugal, France, and Germany...and during the past week is Spain, followed by Italy, and Portugal.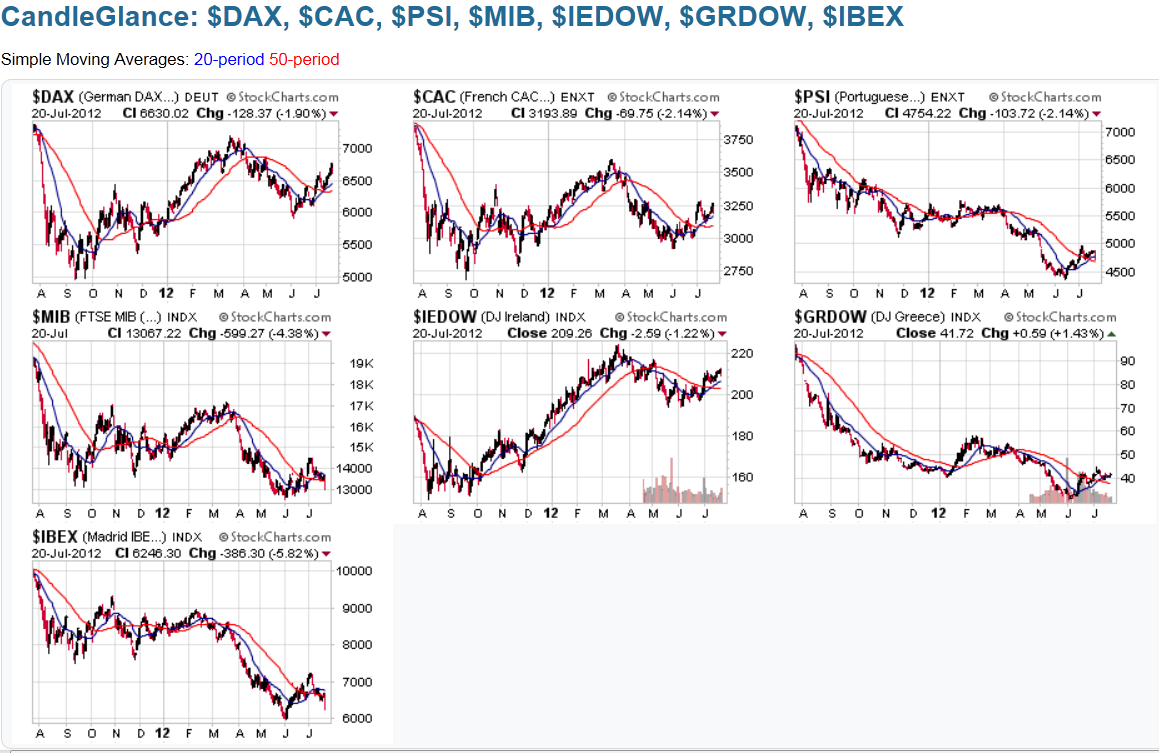
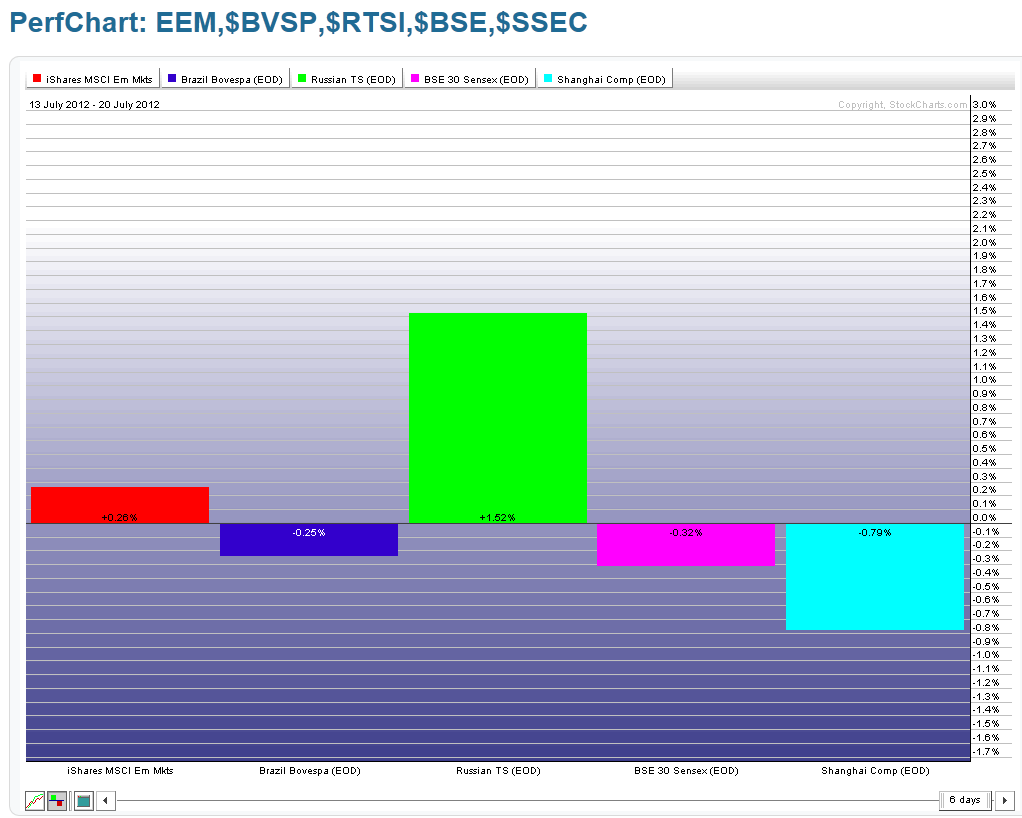
Group 4 features the Emerging Markets Sector (EEM) and the BRIC countries (Brazil, Russia, India, and China). None of the countries nor EEM have made any gains during the one-year period, while Russia and EEM made some gains during the past week. The biggest loser for the year is Russia, followed by China, EEM, Brazil, and India...and for the past week is China, followed by India, and Brazil.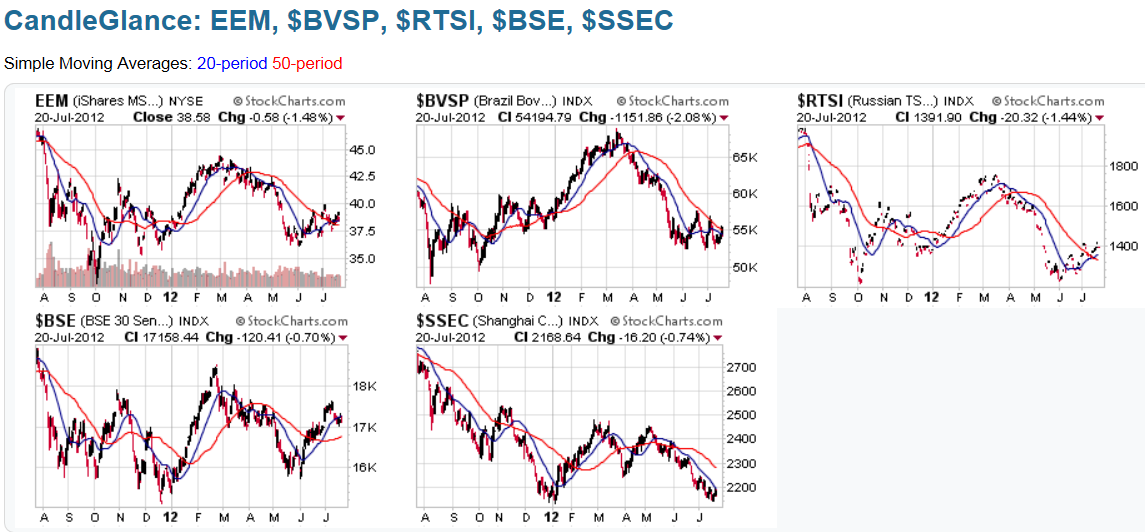
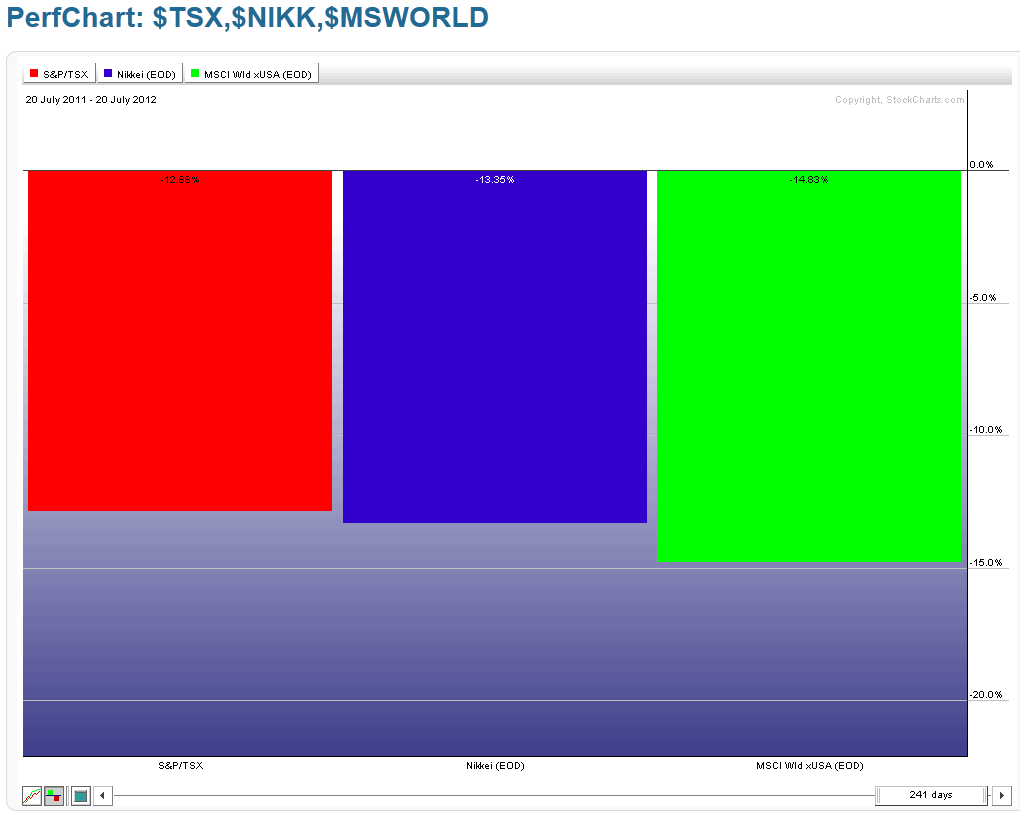
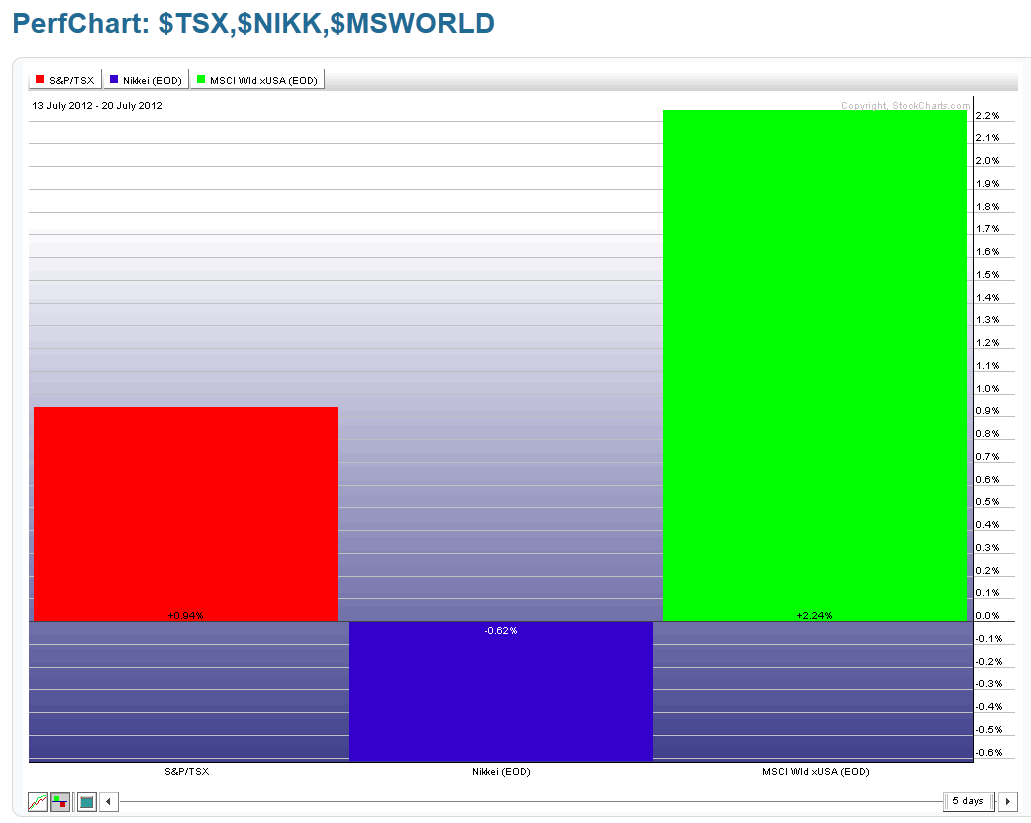
Group 5 features the Canadian ($TSX), Japanese ($NIKK), and World Indices. All of these three are lower than they were one year ago, while gains were made in the World Index and Canada during the past week. The biggest loser during the past year is the World Index, followed by Japan, and Canada...and for the past week is Japan.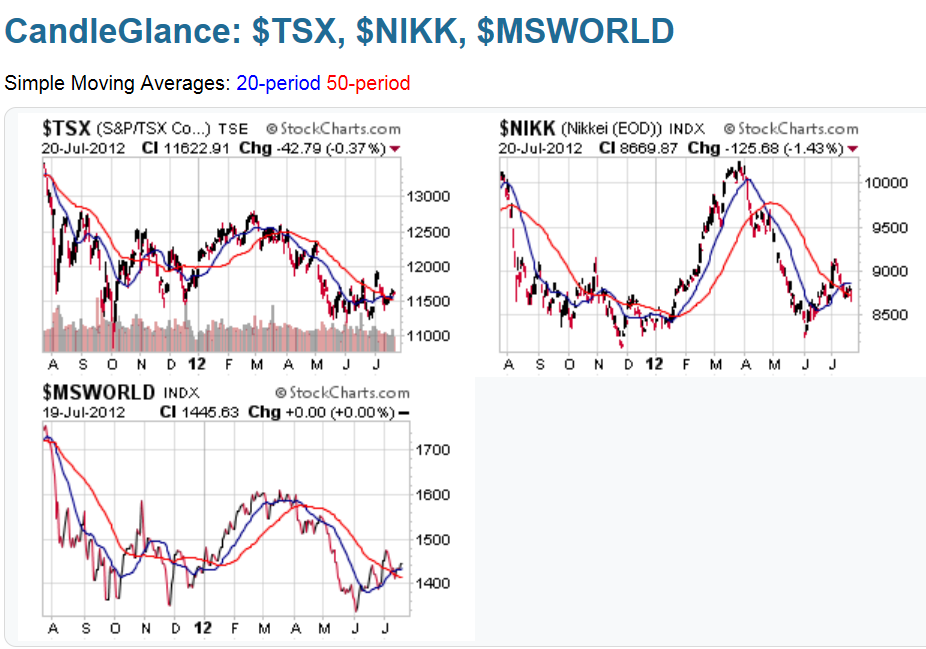
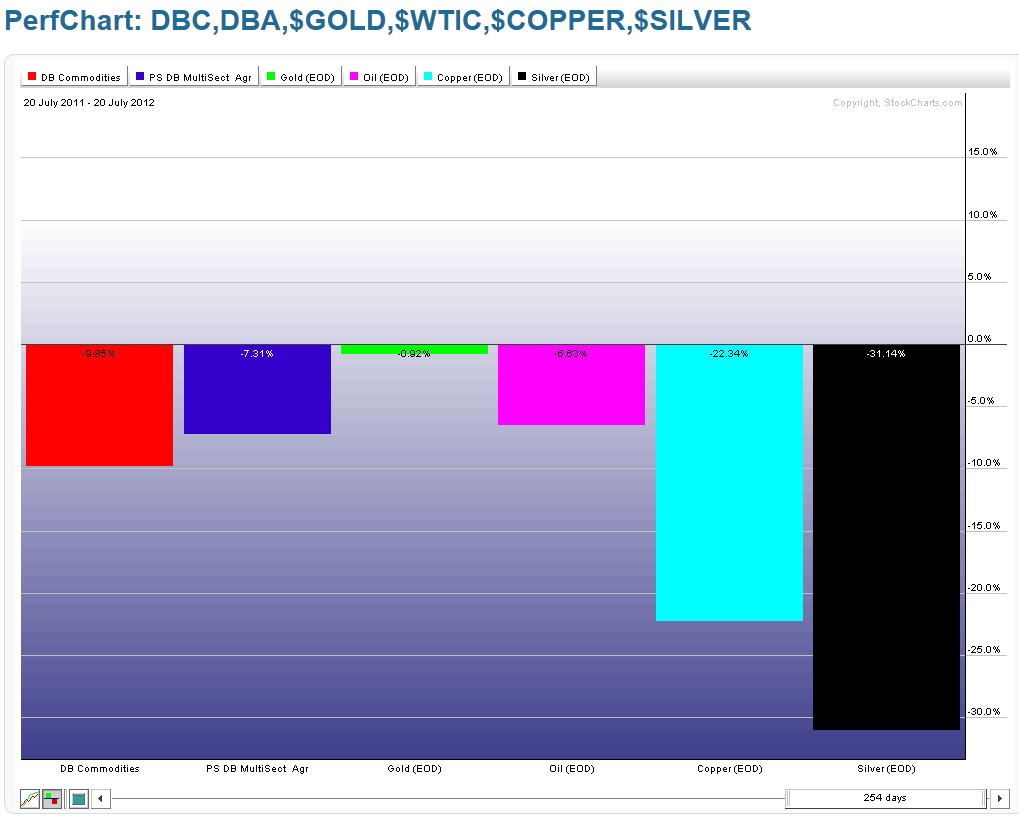
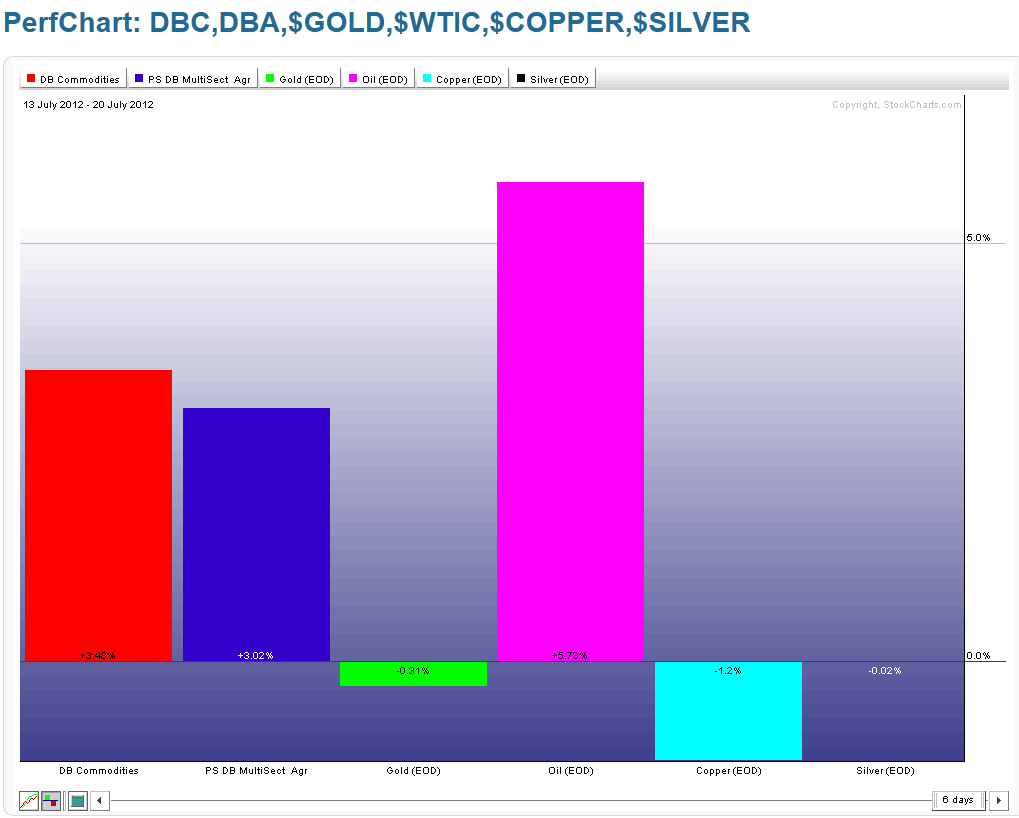
Group 6 features the Commodities ETF (DBC), Agricultural ETF (DBA), Gold, Oil (see my posts of July 17th and July 11th for recent references to Oil), Copper, and Silver. All of these are lower than they were one year ago, while gains were made in Oil, DBC, and DBA during the past week. The biggest loser during the past year is Silver, followed by Copper, Commodities, Agriculture, Oil, and Gold...and for the past week is Copper, followed by Gold.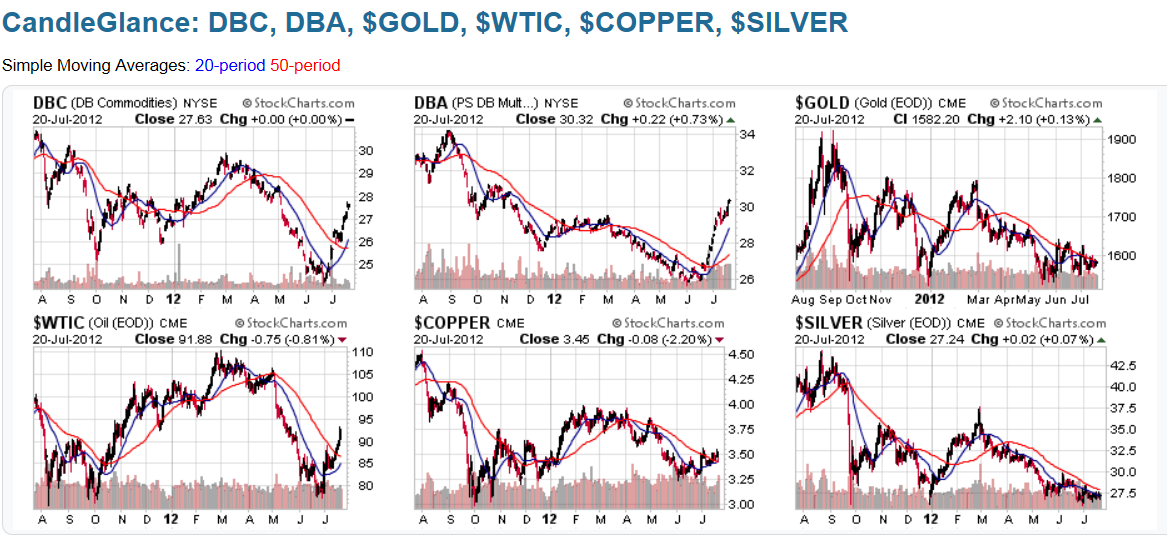
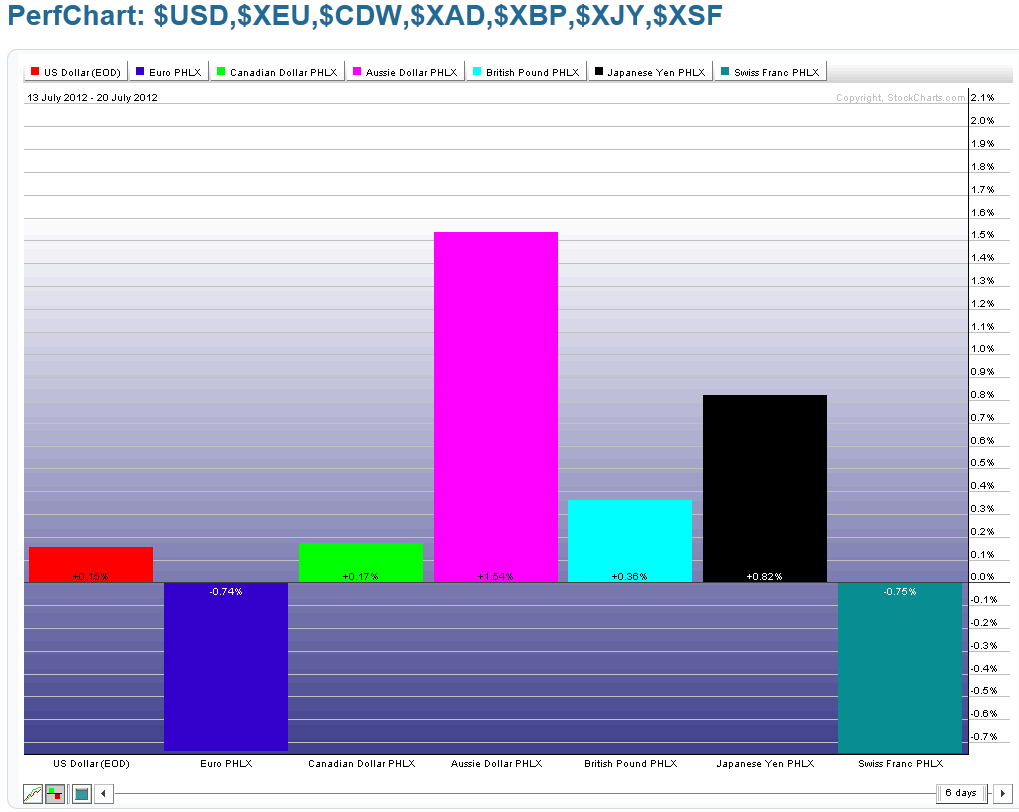
Group 7 features the 7 Major Currencies (U.S. $, Euro, Canadian $, Aussie $, British Pound, Japanese Yen, and Swiss Franc). The U.S. $ has performed the strongest over the one-year period, while gains were made in the Aussie $, Japanese Yen, British Pound, Canadian $, and U.S. $ during the past week. The biggest loser during the past year is the Swiss Franc, followed by the Euro, Canadian $, Aussie $, and British Pound...and for the past week is the Swiss Franc and Euro.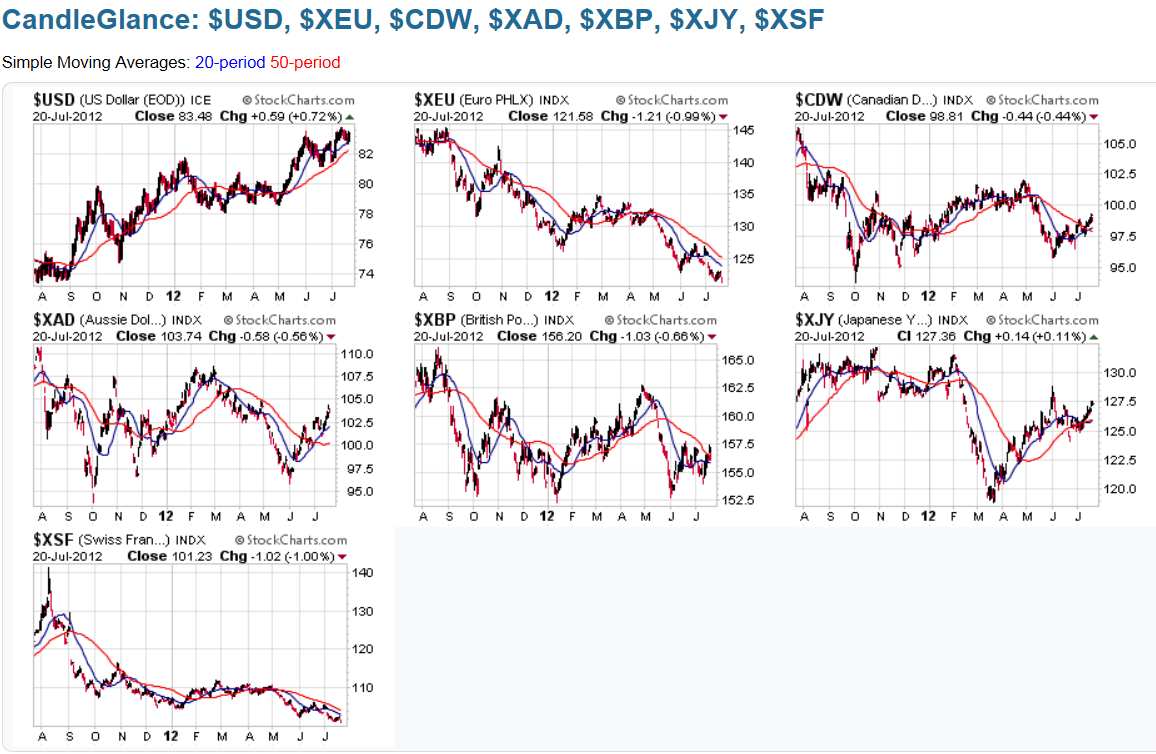
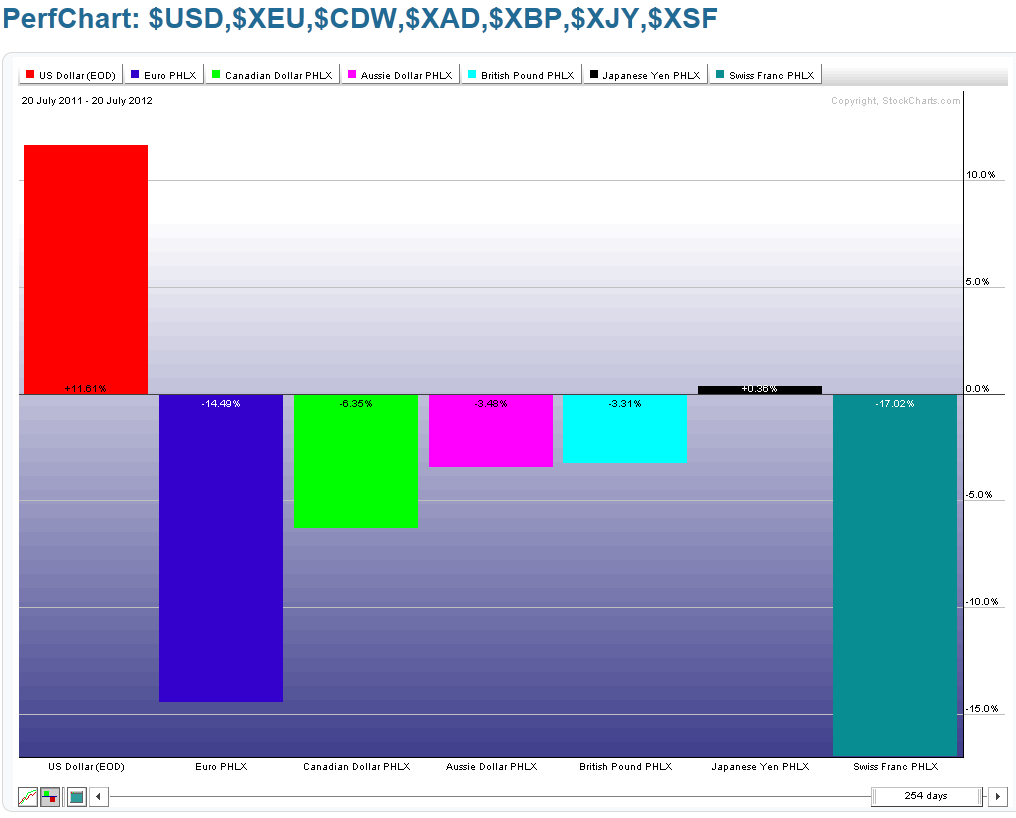
In summary, the markets have been playing defensively over the past one-year period, with the majority of the money flowing into the U.S. $, Utilities, Consumer Staples, Health Care, Nasdaq 100 Index, S&P 500 Index, and Dow 30 Index. Hardest hit during the past year have been Europe, the PIIGS, the BRIC countries and EEM, Silver, Copper, the Swiss Franc, the Euro, Japan, Canada, the Russell 2000 Index, and Dow Transports Index. As such, there has been more weakness, world-wide, than strength during the past year. The one-year leaders are the ones to watch to see if this relative strength continues, or if they begin to weaken.
During the past week, some money has begun to flow into the Aussie $, Japanese Yen, British Pound, and Canadian Dollar, the more risky Sectors such as Energy, Materials, Technology, Industrials, and Consumer Discretionary, Greece, Germany, France, Russia, EEM, the World Index, Canada, Oil, Commodities, and Agriculture...ones to watch to see if this inflow of money continues next week and beyond (perhaps into the next FOMC meeting on July31/August 1st). Headwinds which may present problems for the U.S. markets are outlined in my posts of July 20th, July 19th, and July 17th and will need to be overcome in the process.
- English (UK)
- English (India)
- English (Canada)
- English (Australia)
- English (South Africa)
- English (Philippines)
- English (Nigeria)
- Deutsch
- Español (España)
- Español (México)
- Français
- Italiano
- Nederlands
- Português (Portugal)
- Polski
- Português (Brasil)
- Русский
- Türkçe
- العربية
- Ελληνικά
- Svenska
- Suomi
- עברית
- 日本語
- 한국어
- 简体中文
- 繁體中文
- Bahasa Indonesia
- Bahasa Melayu
- ไทย
- Tiếng Việt
- हिंदी
Money Flow For July Week 3
Latest comments
Loading next article…
Install Our App
Risk Disclosure: Trading in financial instruments and/or cryptocurrencies involves high risks including the risk of losing some, or all, of your investment amount, and may not be suitable for all investors. Prices of cryptocurrencies are extremely volatile and may be affected by external factors such as financial, regulatory or political events. Trading on margin increases the financial risks.
Before deciding to trade in financial instrument or cryptocurrencies you should be fully informed of the risks and costs associated with trading the financial markets, carefully consider your investment objectives, level of experience, and risk appetite, and seek professional advice where needed.
Fusion Media would like to remind you that the data contained in this website is not necessarily real-time nor accurate. The data and prices on the website are not necessarily provided by any market or exchange, but may be provided by market makers, and so prices may not be accurate and may differ from the actual price at any given market, meaning prices are indicative and not appropriate for trading purposes. Fusion Media and any provider of the data contained in this website will not accept liability for any loss or damage as a result of your trading, or your reliance on the information contained within this website.
It is prohibited to use, store, reproduce, display, modify, transmit or distribute the data contained in this website without the explicit prior written permission of Fusion Media and/or the data provider. All intellectual property rights are reserved by the providers and/or the exchange providing the data contained in this website.
Fusion Media may be compensated by the advertisers that appear on the website, based on your interaction with the advertisements or advertisers.
© 2007-2025 - Fusion Media Limited. All Rights Reserved.
