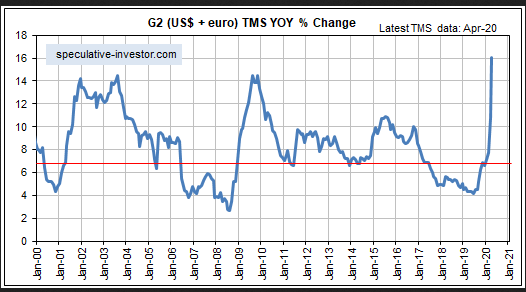
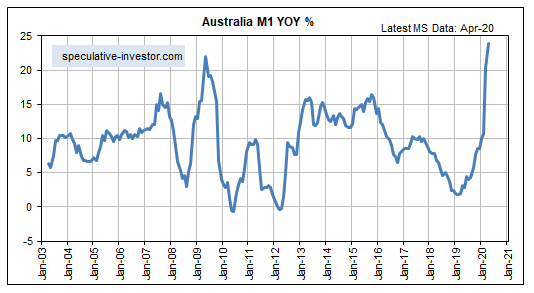
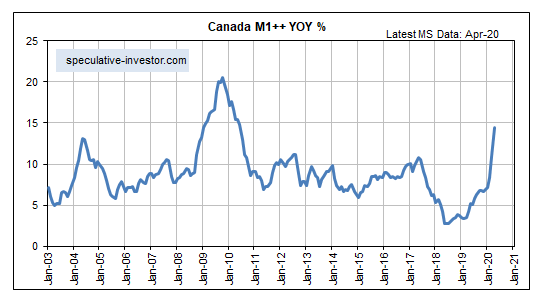
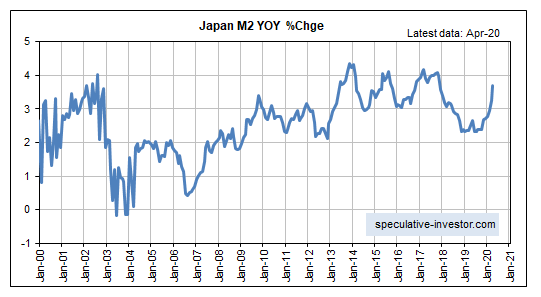
In most countries/regions, the money-supply growth rate bottomed in 2019 and by the beginning of this year was in a clear-cut upward trend. Then came the “coronacrisis,” involving widespread economic lockdowns and unprecedented central bank money/credit creation designed to counteract the effects of the lockdowns. A result was a veritable explosion in monetary inflation rates around the world during March and April (April being the latest month for which there is complete money-supply information). Here are some examples:
1) The combination of US and euro-zone money supply that we call G2 True Money Supply (TMS) was at a 10-year low in the middle of last year. It is now at an all-time high. This is by far the most bullish force currently acting on equity and commodity prices.

2) Early last year Australia was in danger of experiencing monetary deflation, but this country’s monetary inflation rate has since rocketed to an all-time high of 24%. This is not bearish for the Australian dollar relative to other currencies and especially not relative to the US dollar (we suspect that the AUD$ will trade at parity with the USD within two years), because the AUD’s exchange rate is influenced to a far greater extent by the commodity markets than by the local monetary inflation rate. However, it suggests that in Australia the prices of goods, services and assets will go up a lot over the next few years.

3) The Bank of Canada has been a little more circumspect than most other central banks over the past few months, but in response to the recent crisis it has done enough to boost the country’s monetary inflation rate to near a 10-year high. A year ago it was near a 20-year low.

4) We occasionally read articles that attempt to make the case that central bank money pumping does not lead to higher prices, with the situation in Japan cited as evidence. Japan supposedly is relevant because the Bank of Japan (BOJ) has been aggressively monetizing assets for a long time with minimal effect on prices.
As we’ve noted many times in the past, prices have been stable in Japan because Japan’s monetary inflation rate has oscillated at a relatively low level for decades. Whatever the BOJ has been doing, it has NOT been pumping money at a rapid rate. Even now, in the face of additional monetary stimulus, the year-over-year rate of growth in Japan’s M2 money supply is below 4%. This contrasts with a US money-supply growth rate of almost 20%.
Therefore, the low rate of price inflation in Japan is in no way mysterious. It’s exactly what would be expected from an economy with a low rate of monetary inflation and some productivity growth.

In summary, outside of Japan the supply of currency is increasing at such a fast pace that there WILL be substantial price increases over the next two years. However, the price increases won’t be uniform. For example, due to a high unemployment rate the price of labor probably will be a laggard, and due to their relative supply situations the price of oil probably won’t rise by as much as the prices of uranium, natural gas, copper, nickel and zinc.
