The US stock market has been on a roller coaster for much of 2018, but the surge in volatility hasn’t derailed the momentum’s leadership for US equity factors, based on a set of proxy ETFs.
For year-to-date results through last week’s close (May 25), the iShares Edge MSCI USA Momentum Factor (NYSE:MTUM) still leads the field. MTUM’s 8.1% return so far this year is comfortably ahead of the competing factors as well as the broad market, based on the SPDR S&P 500 (MX:SPY (NYSE:SPY)), which is up a comparatively mild 2.4%.
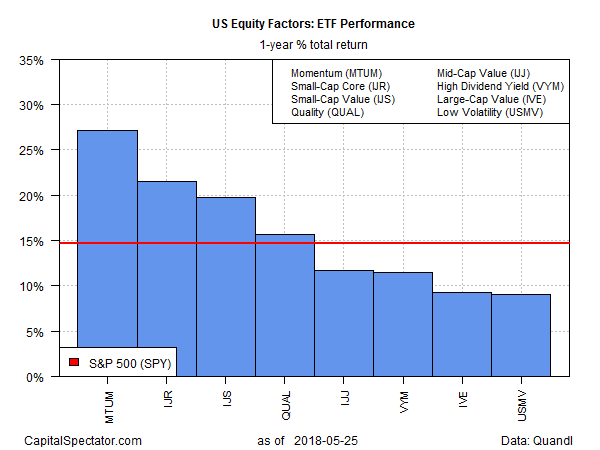
Momentum is also the top performer for the one-year trend. MTUM’s current total return for the trailing 12-month period is a strong 27.1%. That’s a solid edge over the other factor funds and is nearly twice as strong as the broad market’s 14.7% one-year total return via SPY.

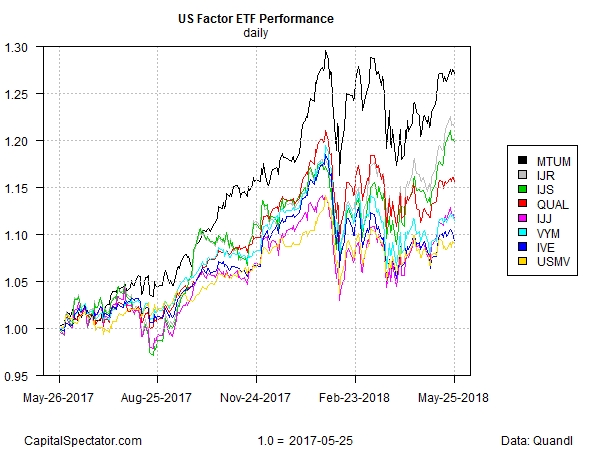
Reviewing wealth indexes for the factor ETFs for the trailing one-year period clearly illustrates momentum’s bull run. Although the fund has been trading below its recent highs lately, the chart below reminds that MTUM’s strong performance (black line at top) remains in a class of its own.

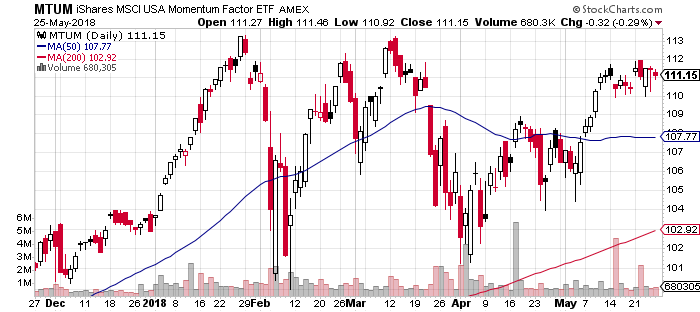
The long-running dominance of the momentum factor can’t last forever, but for now it’s not obvious that the factor strategy’s leadership is due to stumble. For example, the ETF still enjoys a bullish technical profile: the fund closed last week at well above its 50- and 200-day moving averages.

If a changing of the guard does unfold in foreseeable future the challenger may be small-cap equities. Indeed, the small-cap factor has enjoyed a strong run recently: the iShares Core S&P Small-Cap (NYSE:IJR) is currently posting a healthy 21.5% total return for the past year, second only to MTUM. For the year-to-date profile, the two ETFs are essentially running neck and neck: MTUM’s up 8.0% this year, just slightly ahead of IJR’s 7.8% year-to-date gain.
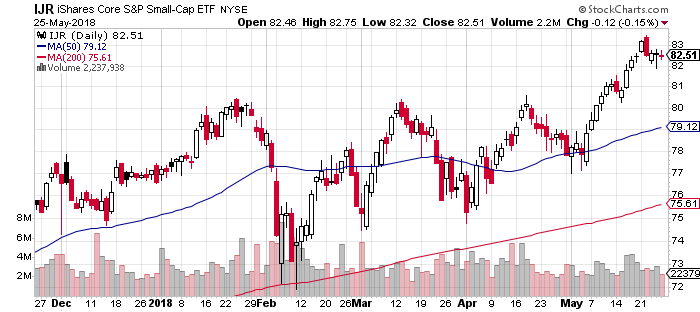
Meantime, IJR’s technical profile looks strong. Notably, the ETF has enjoyed a strong rally this month:

The broad market’s beta risk is the elephant in the room for all the factor funds and so a trouble in equities overall would be a major headwind in all corners. But assuming that stocks writ large don’t run into trouble in the near term, the momentum/small-cap horse race looks set to be the main event this summer in the factor-strategy horse race.
