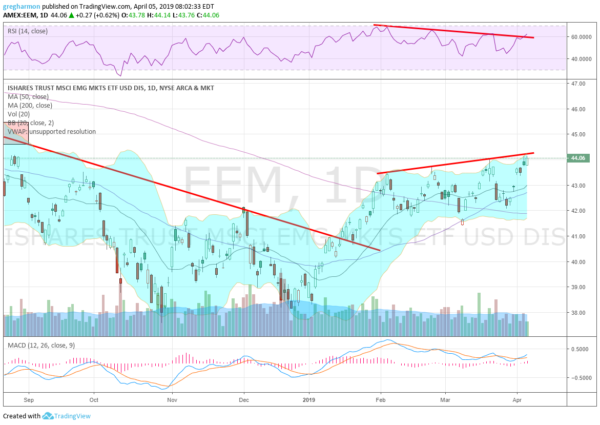
Emerging Markets bottomed with U.S. Equity markets at the end of December. They started to move higher into the New Year and pushed over their 200 day SMA at the end of January. But they stalled shortly after, and settled into a slow rising channel. The channel has had well defined trend resistance, with less well defined support.
The differential in support can be interpreted as creating an Inverse Head and Shoulder (IHS) pattern in the Emerging Markets ETF (NYSE:EEM) below. Coming into Friday the price is back at that trend resistance, and what would be the neckline of the IHS. It is also at a 7 month high. Why buy it now?

Momentum! The chart shows a turn up in the MACD, in positive territory. That is a plus but nothing terribly special. It also shows a Golden Cross from March 18, with the 50 day SMA crossing up through the 200 day SMA. Another plus but still part of the supporting cast. The final piece though, the RSI is breaking a divergent downtrend.
Through the entire run higher against resistance the RSI has been moving lower against its own trend resistance, in a different direction from price. The break of that trend Thursday may be just what was needed to start the Emerging Market ETF moving in a stronger path higher again.
Disclaimer: The information in this blog post represents my own opinions and does not contain a recommendation for any particular security or investment. I or my affiliates may hold positions or other interests in securities mentioned in the Blog, please see my Disclaimer page for my full disclaimer.
