Key Points:
- Near-term bias remains bearish but a reversal should be on the way.
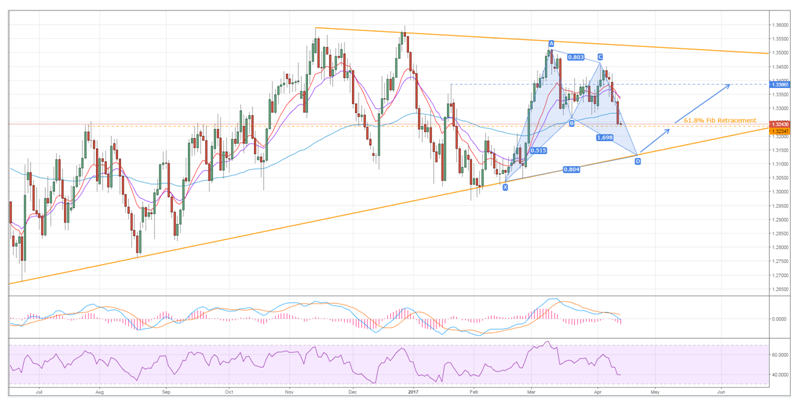
- Gartley pattern and falling wedge are the two key structures in play.
- Currently waiting for the 61.8% Fibonacci level to break.
In the wake of the Bank of Canada’s Overnight Rate decision, it may be worth taking a closer look at the loonie’s technical forecast to get a feel for what could be on the way over the coming weeks. As we do this, it will likely become apparent that we could see some fairly sharp reversals as the pair continues to navigate its long-term consolidation phase whose end is not yet in sight.
First and foremost, let’s look at what is in the cards for the near-term given that we have seen some heavy selling pressure over the past week. Of course, a large portion of this downside price action stems for the broader market’s swing away from the USD following a rather torrid week of geopolitical and Trump-based headline risk. Nevertheless, this plunge lower also has broad support from the technical bias which is actually indicating that further losses could now be warranted.

In particular, the latest slip has now forced the EMA configuration into one of the more bearish positions. Notably, price action is below the 100 day moving average and the two shorter averages have now experienced a bearish crossover. Additionally, the MACD remains bearish alongside the Parabolic SAR readings. Most importantly, there is a loose Gartley pattern becoming apparent which could see the pair sink even lower as we move forward.
All this being said and done, there is still one final hurdle that the bears will need to overcome before we can be relatively certain that we do in fact have further losses on the way. Specifically, the 61.8% Fibonacci level remains intact which could hamper any efforts to mount that final push back to the downside constraint of the long-term falling wedge. Fortunately, with the exception of the stochastics being in oversold territory, there is little in the way of technical evidence to suggest that this level should hold which means losses are like to restart shortly.
Once the tumble has resumed, we expect the pair to sink to around the 1.3128 level before running into another impasse. Namely, the presence of the downside of the wedge should prove to be a robust support which would take a fundamental upset to be broken. However, the ending on the Gartley pattern will also be worth keeping in mind as this would typically suggest that an uptrend should be on the way in fairly short order. This upswing could extend as high as the 1.3386 mark but it will likely run into resistance around the 1.3234 handle as that Fibonacci level and the 100 day EMA provide a decent cap on upside action.
