The US Dollar Index had been toeing the line. Waiting for a move. Consolidating in a range for over 2 months. This was happening at the early November 2017 high. It could take a long time to work through this consolidation. Or it could fail. Of course it could also explode to the upside, like it did last week. Were you caught off guard when the move came? You may get a second chance.
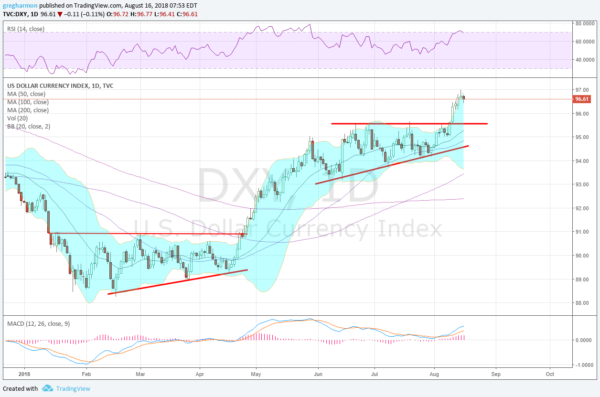
The chart below shows the US Dollar Index over the last 8 months. After a bottoming process that ended with a break of an ascending triangle to the upside, the Dollar rose quickly, exceeding the target move to 93.50 by the end of May and continuing higher. It moved into a higher consolidation in June and cycled there for over 2 months. The tightening consolidation with the rising 50 day SMA as support built another ascending triangle. As the squeezed Bollinger Bands® opened the Dollar Index exploded to the upside in August.
With a target of 97.50 you may think you have missed this run. And maybe you have. But a technical pattern combined with some momentum signals is suggesting you may get a second chance. The candlestick Wednesday, a Shooting Star, is a possible reversal candle. And early Thursday the Dollar is heading lower. It will take a lower close Thursday to confirm a reversal. If that happens it would not surprise many technicians to see a retracement back to the break out level before a continuation higher. Momentum indicators support this with the RSI overbought and rolling over and the MACD leveling. Your 2nd chance to participate in a Dollar run might be upon you shortly.
The information in this blog post represents my own opinions and does not contain a recommendation for any particular security or investment. I or my affiliates may hold positions or other interests in securities mentioned in the Blog, please see my Disclaimer page for my full disclaimer.

