Small cap stocks are often thought of as the growth engines of strong market cycles. Investment in these companies engenders the notion of higher risk and magnified price fluctuations compared to their larger peers. As a result, these stocks tend to have streaky performance that can experience periods of strong relative gains or lagging returns.
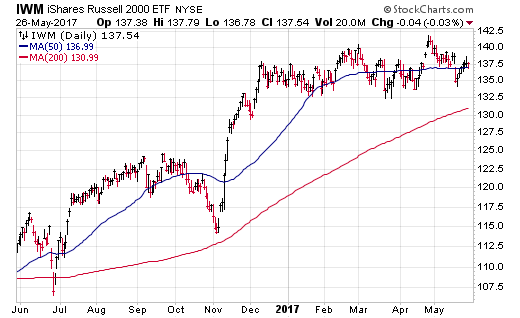
The latter characteristic is what many would use to describe the current price action of exchange-traded funds that track small cap stocks. These passive index funds have meaningfully underperformed traditional large-cap benchmarks as price patterns meander in a sideways trend.
The most widely followed benchmark for this category is the iShares Russell 2000 (NYSE:IWM). This ETF has exposure to nearly 2,000 stocks with total assets of $35 billion. It’s a highly diversified, liquid, and tax-efficient vehicle for exposure to the small-cap segment of the U.S. stock market.
The composure of the Russell 2000 Index is such that the weighted average market capitalization of the underlying holdings is $2.3 billion. Top sector allocations include: financials, technology, and industrials, which together make up over 50% of the funds’ portfolio.
As you can see on the chart below, IWM has traveled in a tight and narrow range over the last six months since the post-election jump. The fund has gained just 2.26% through the first five months of 2017 versus 8.60% for the SPDR S&P 500 ETF (NYSE:SPY).

This consolidation pattern has created an interesting dynamic for investors to interpret in varying ways. Some may view the slow down as a positive in that new opportunities await for the next big jump. Conversely, others may be skeptical about the ability for large-cap stocks to carry the entire burden of momentum without hitting a stumbling block in the near-term.
From a pure performance standpoint, it’s reasonable to assume that investors will lose patience with the continued flat trend in small caps and begin to look elsewhere to generate growth. Large-cap technology stocks are getting a great deal of attention for their unrelenting strength. This sector would be a likely landing spot for those who are quick to jump ship on a snoozing investment class. Nevertheless, fund flow data shows a muddled picture of shifting allegiances in the small cap genre.
Data from ETF.com indicates that $3.8 billion of net assets have departed IWM since the beginning of 2017. Yet, even more money has been swallowed up in similar funds with lower expenses. The iShares Core S&P Small-Cap (NYSE:IJR) has taken in $3.4 billion over that time frame, while the Vanguard Small-Cap (NYSE:VB) has added $1.5 billion.
These alternative small cap ETFs have seen most of their weekly flows on the positive side of the ledger throughout the year. This is likely the difference between institutional portfolios using IWM as a short-term trading vehicle, versus retail and advisor money flowing into IJR and VB with the expectation of longer holding periods.
Cost is another king factor when comparing ETFs in a similar category. IWM charges an expense ratio of 0.20% versus 0.07% for IJR and 0.06% for VB. While those differences may seem miniscule on the surface, the psychological pull of lower investment fees has taken on a more prominent role in the ETF decision process in recent years.
The Bottom Line
While it’s unlikely to be a single critical catalyst, the direction of small cap stocks should be a noteworthy indicator for investors to monitor. This divergence may foretell shifting momentum dynamics in the market or demonstrate a relative value opportunity for those who are underinvested in the category.
Whatever the case may be, the top ETFs that track this segment are excellent tools for investors to utilize for exposure. They all demonstrate the characteristics of low costs, high diversification, and excellent tracking to their respective indexes.
Disclosure : FMD Capital Management, its executives, and/or its clients June hold positions in the ETFs, mutual funds or any investment asset mentioned in this article. The commentary does not constitute individualized investment advice. The opinions offered herein are not personalized recommendations to buy, sell or hold securities.
