This month’s pickup in year-on-year profit growth for large-cap Chinese industrials combined with Chinese steel mills shifting to buy higher-grade iron ore has seen short-term momentum turn firmly bullish for the miners. Given the sector's stellar longer-term uptrend, this is something that investors should note.
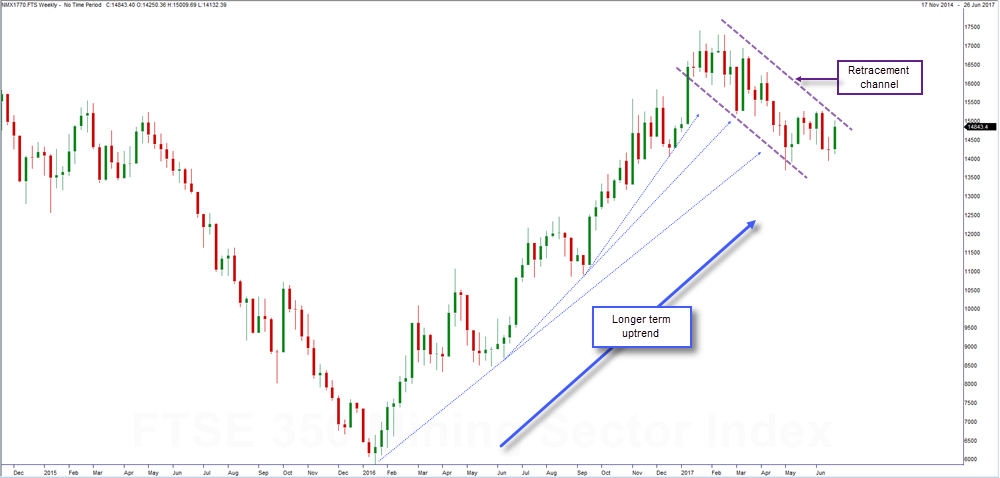
For those that need reminding of how strong the 2016 run was, the below 3-year weekly candle chart for the FTSE 350 Mining Sector.
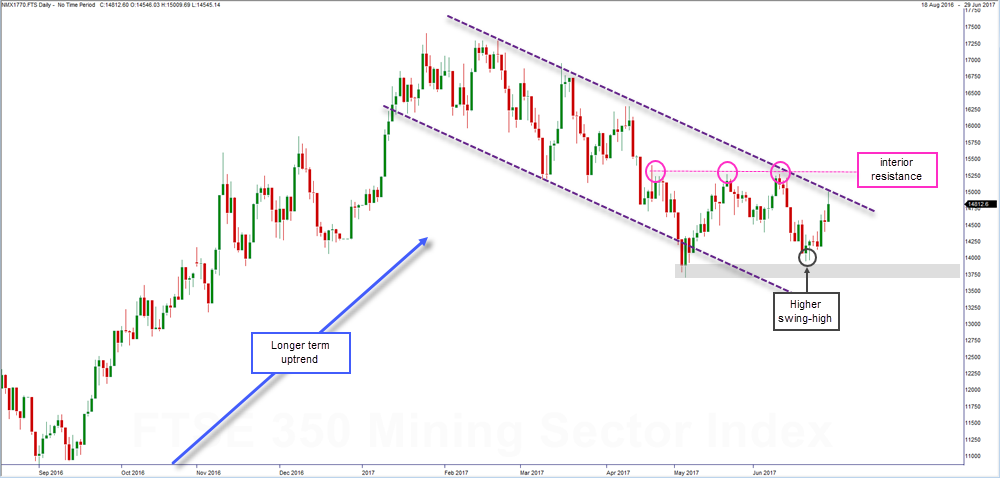
The chart also highlights that this year the index has printed a series of lower swing highs and lower swing lows, forming a ‘retracement channel.’ Dropping down a timeframe we can view this ‘retracement phase’ in more detail, and crucially by doing so, we see clear signs that the tide is turning. See below for the 9-month daily candle chart for index.
With the index parked at the top of the retracement channel, bears have cause to argue that the probabilities favor miners rolling over from here. However, we point to last weeks’ price action, noting that for the first time since early January, the index has made a higher swing low.
Price action such as this during a retracement phase can offer an early signal that a change of market structure is on the cards. Moreover, with the miners showing high levels of relative strength versus the wider market, there is every likelihood that this is exactly what we are seeing.
Should we see the index decisively break and close above interior resistance,we would have clear evidence that the retracement phase has been exited. This could pave the way for another 2016 style rally to play out and were this to happen, then it would be the case of picking the best performing peers within the sector.


