Stocks acted great all week until Thursday showed cracks which are telling me stocks area going to move lower in another correction, and Friday seemed to confirm this but we haven’t released hard lower quite yet.
We locked in some nice gains Thursday and now I’m, looking to grab some quick gains on the downside.
Of course, if I’m proven wrong I’l be out of my shorts and back into longs.
Weeks worth of gains have been taken away quickly unless you can be quick enough and recognize the change in behaviour and act upon it.
The action in stocks remains tricky with Wednesday being one of the best days this year and we should have continued nicely higher to end the week, but it just didn’t happen.
Since early February we’ve seen the trend of weaker starts to the week followed by a strong end to the week and that is positive action but this week things changed.
The point being, the action remains tricky and sloppy and we look set to correct now.
As for the metals, gold and silver remain in choppy ranges and look set to move lower, but, miners are showing some strength and we saw the long dead junior miner group ink a few deals and once again begin to come to life.
Let’s begin with the GDX (NYSE:GDX) chart which is one of my favorite for a general overview of miners.
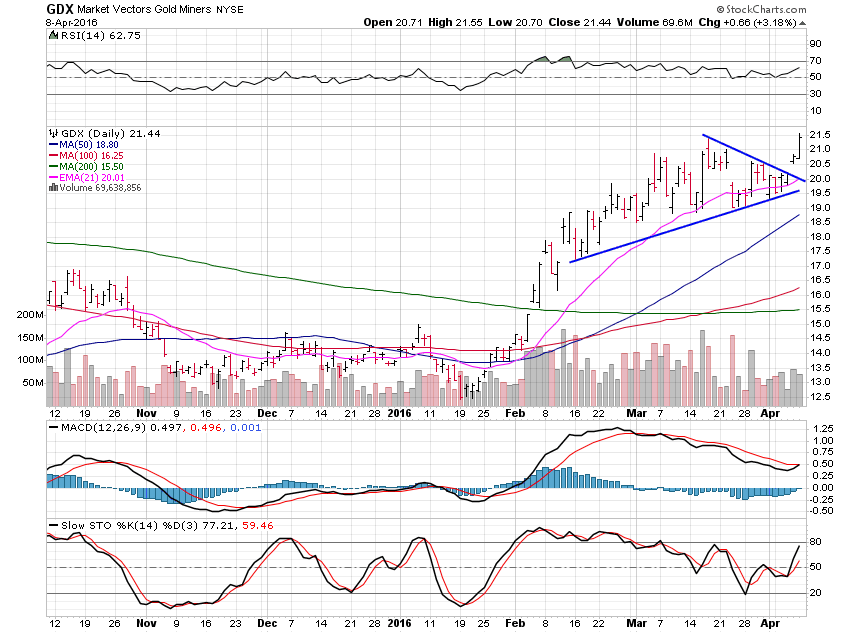
GDX is breaking out of the triangle pattern well now but is lacking a bit in the volume department.
GDX looks good to me as long as it can stay above $21.
Miners often lead the metals so let’s check out the metals charts and see what I see this weekend.
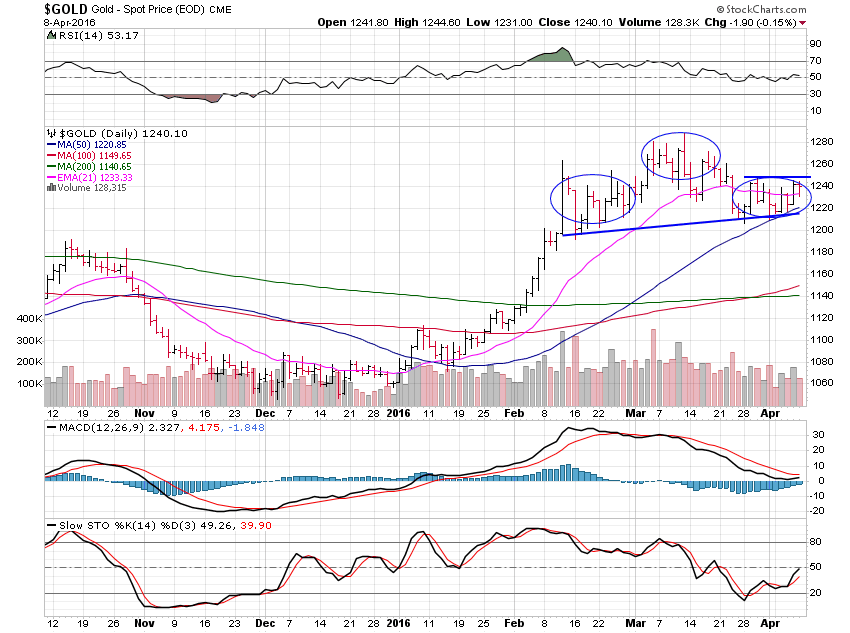
Gold gained only 1.35% this past week as it appears to build out the right shoulder of the head and shoulders pattern.
Unless gold can move above the $1,245 area then the head and shoulders pattern remains valid.
A break of the $1,220 area is the short level but it may not come to us with miners on the move higher.
It’s a mixed picture with mining stocks and the commodity moving at odds.
The head and shoulders pattern does point to a $60 move lower which would mean the $1,180 support level that I’ve said is likely to be tested.
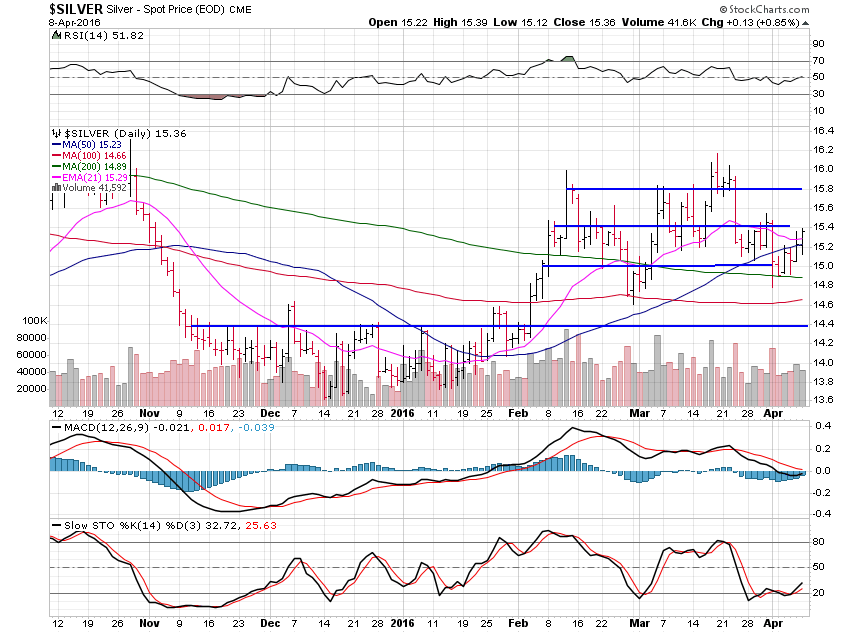
Silver gained 2.06% for the week but is also acting choppy.
A move above $15.40 would be positive while a break under $15 negative and likely push us to the $14.40 support level.
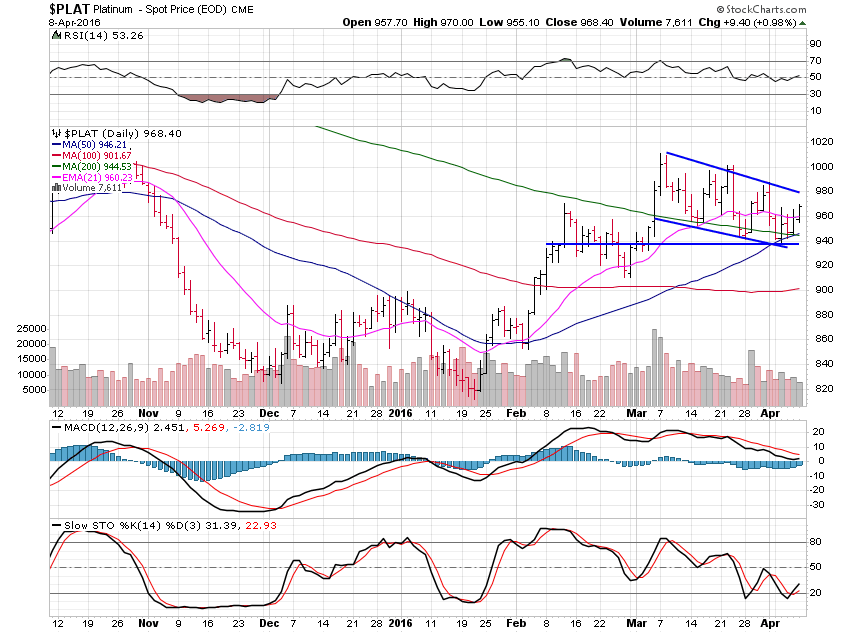
Platinum gained 0.89% this past week and continues to look setup to move higher.
Platinum has a decent descending channel which should take it higher but it won’t happen if gold and silver break lower.
A move above $980 would be positive while a break under $940 is negative.
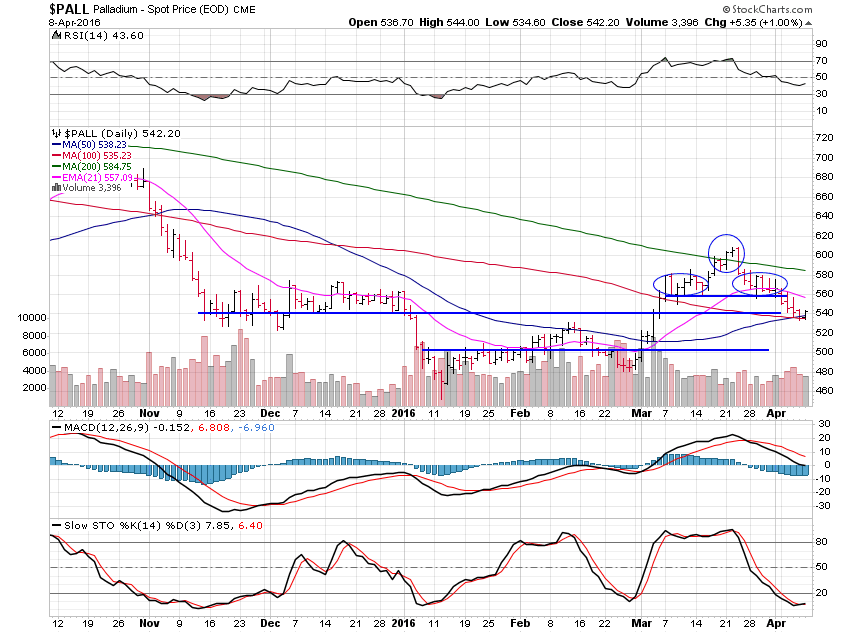
Palladium lost 4.29% this past week and is now at support levels.
The small head and shoulders pattern saw palladium break lower this past week and hit it’s target near the $540 level so now we see if we can hold here and move higher.
As always, this will depend on the action in gold and silver.
If palladium cannot hold $540 then $500 is the next support area to look for.