S&P 500 Futures: What Volatility?
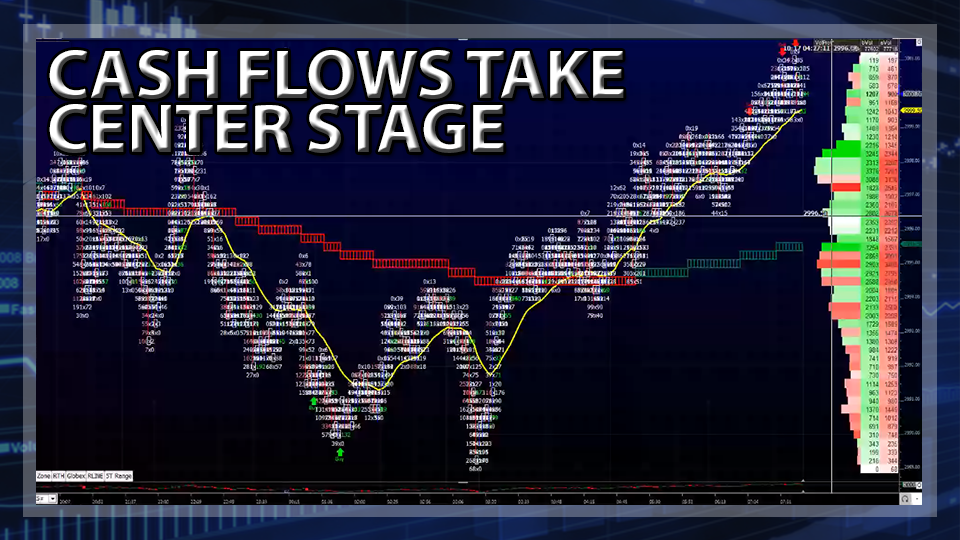
The S&P 500 Futures closed at 2997.95 on Thursday, slightly below where they opened at 3000.75, and smack dab in the middle of its trading range (2991.79 – 3008.29) for the second day in a row.
Where did all of the volatility go? What traders wouldn’t give for a daily trading range in excess of 20 points. It’s not that the markets are ‘boring’, but more so that ‘stability’ is making a comeback.
Did you expect anything less than a last minute deal on Brexit?
It could not have been scripted better. President Trump should be licking his chops for an increased number of “entities” with a common interest; doing business with the United States. In my book, that has value, it’s smart to create competition.
A true Brexit deal will put a lid on further interest rate declines, but there’s hope for a transfusion of cash employing the usual technique sometimes practiced daily; expansion of the balance sheet.
From time to time an article comes my way that lays the groundwork for a subject important enough to learn something from. I preach money flow when espousing macroeconomic theory, and in the following article they give it meaning:
World Dollar Liquidity Crashes as Does Marginal Utility of Debt: https://www.fxstreet.com/analysis/world-dollar-liquidity-crashes-as-does-marginal-utility-of-debt-201910162243?utm_source=onesignal&utm_medium=push&utm_campaign=analysis
Cash Infusions
If Trump turns on the manufacturing machine, augmented by a decrease in the value of the dollar, additional help from the Federal Reserve will be necessary. By lowering interest rates, international markets will need hard money, or cash flow, then a reason for the recipient of the infusion to spend it.
With trade issues running rampant around the world, ‘money flows’ remain a critical piece of the puzzle and analysis. Increased tariffs are having an effect on the ‘movement’ of money.
China missed on GDP last night, and the PBoC has a rate decision to make next week. The dollar has been cooperating with downside technicals prevailing, and the next move should be a little more dramatic.
Looking Ahead
Our week is just getting started. It’s fall, temperatures are naturally going to decline, consumption of natural gas will increase, so it’s time to awaken the “widow maker”.
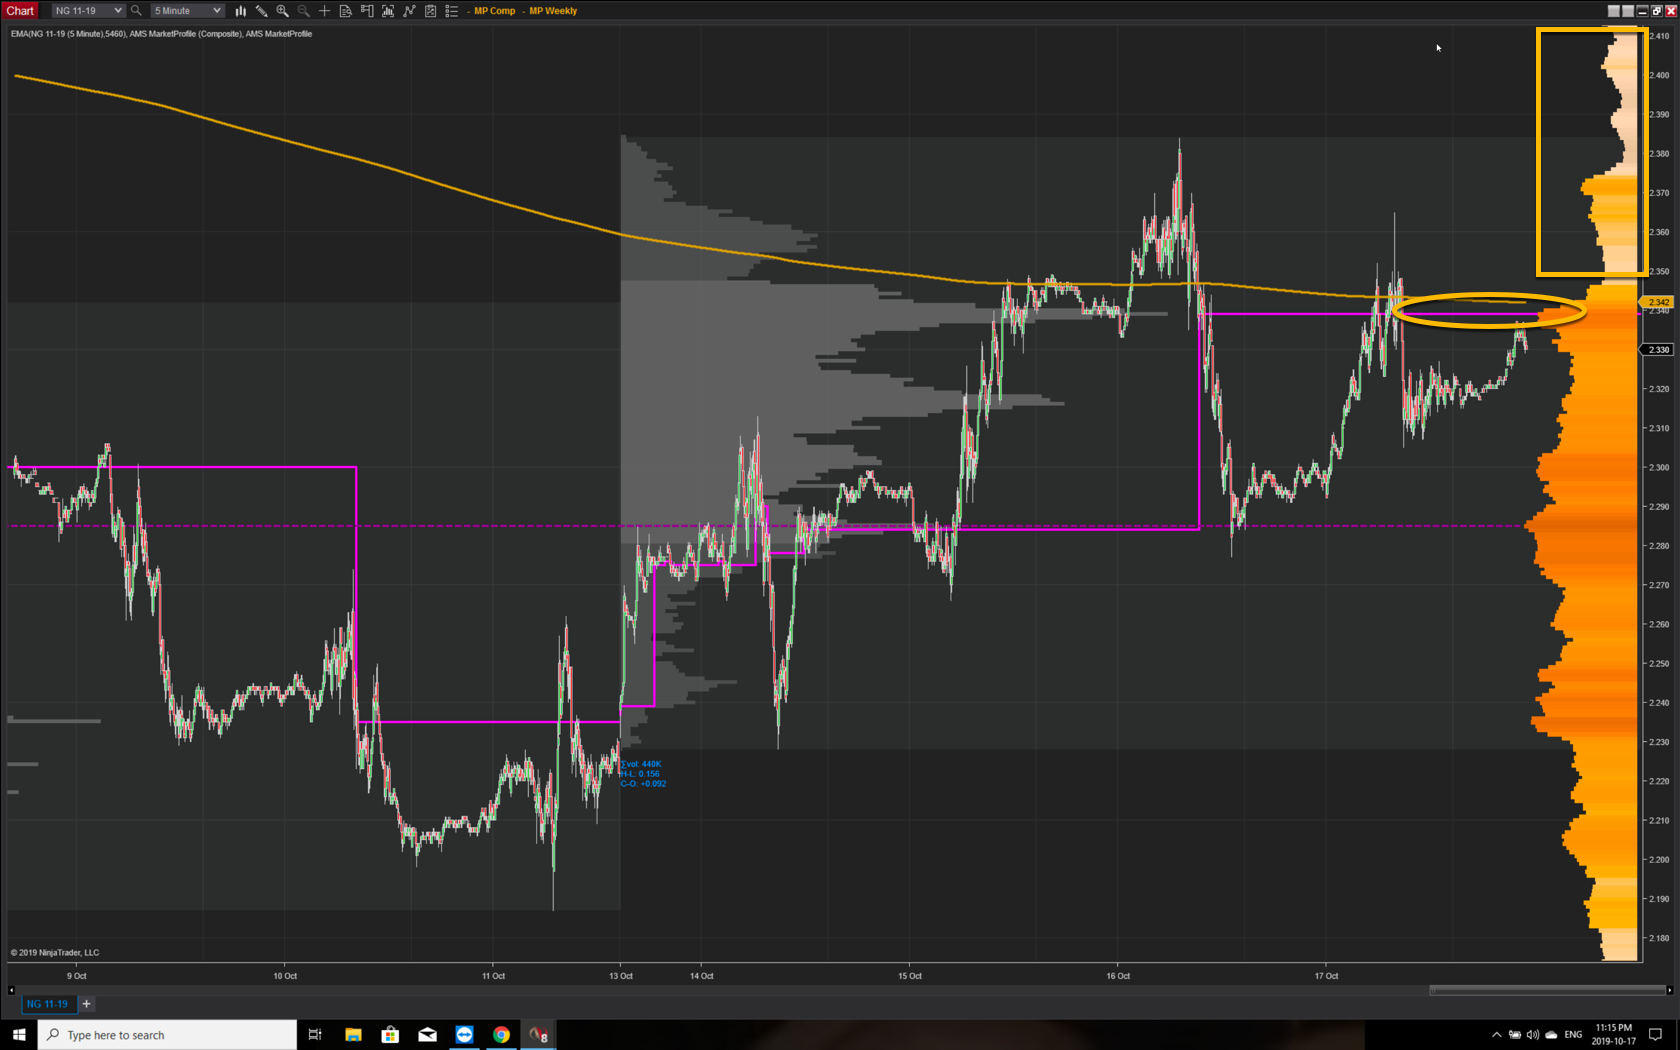
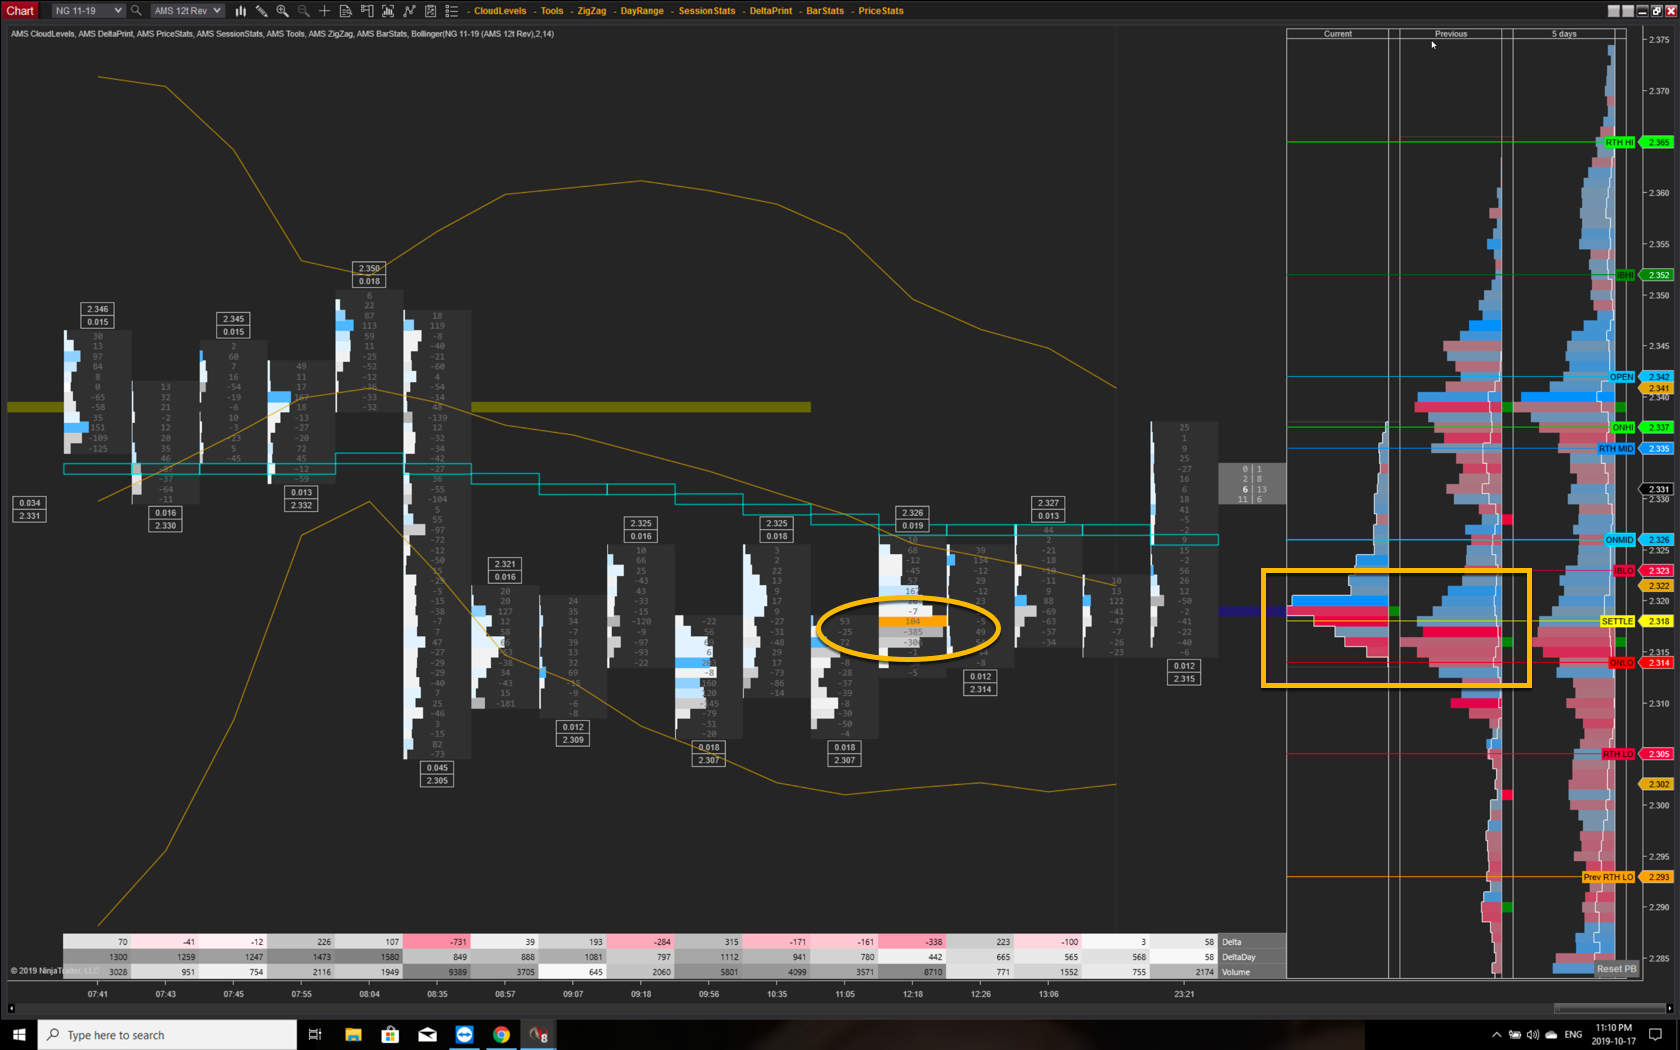
We begin with shorter and longer term MarketProfile charts, complimented by our DeltaPrint template.

Chart courtesy of AMS Trading Group
The longer term MarketProfile chart shows a bottom complimented by northerly movement in the shorter term version.

Chart courtesy of AMS Trading Group
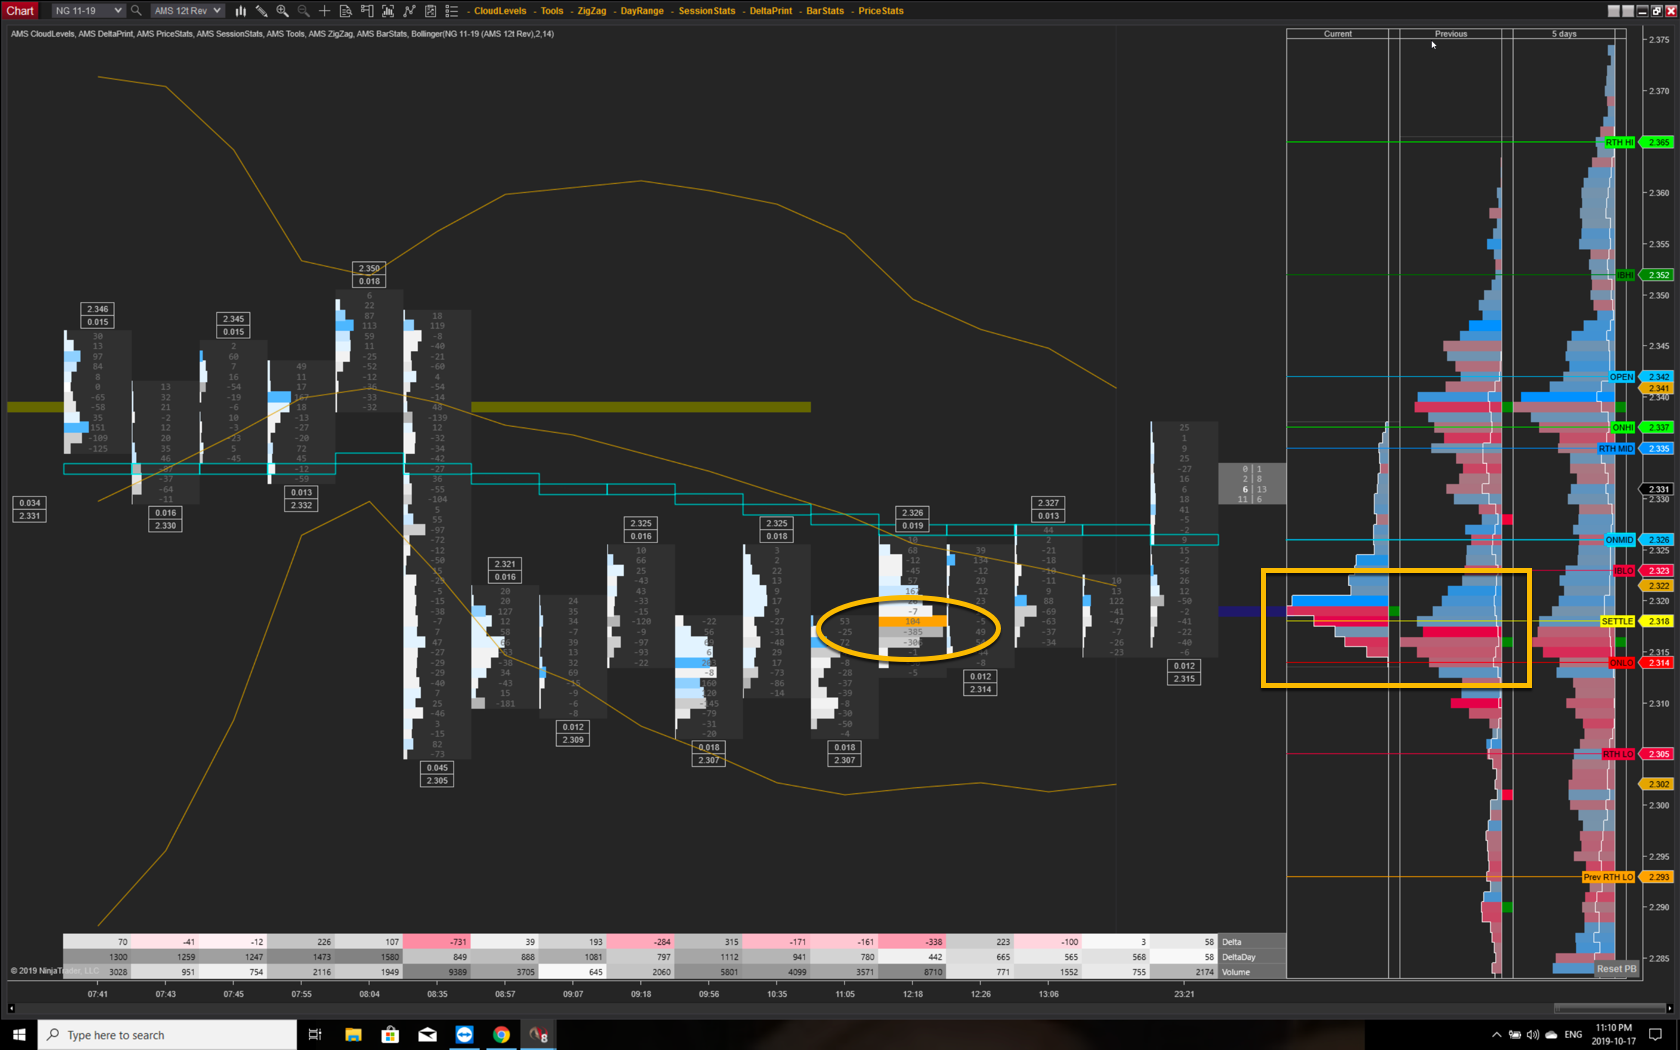
DeltaPrint will give us our entry points. At this time there are none, but stay tuned, we’ll let you know when there are.

Chart courtesy of AMS Trading Group
Remember, upwards of 82.5% of the 63 S&P firms reporting beat their respective street’s estimates. The muted reaction suggests a now expected norm. Why have estimates?
