It's been a lively start to the Asian session as the focus continues to orbit around the escalation in the US-Iran geopolitical tensions following the death via a drone-initiated airstrike of Iran’s top military leader in Baghdad last Friday. This event set out a risk-off tone in markets since which still continues. We are starting the new decade with decent levels of FX volatility.
Quick Take
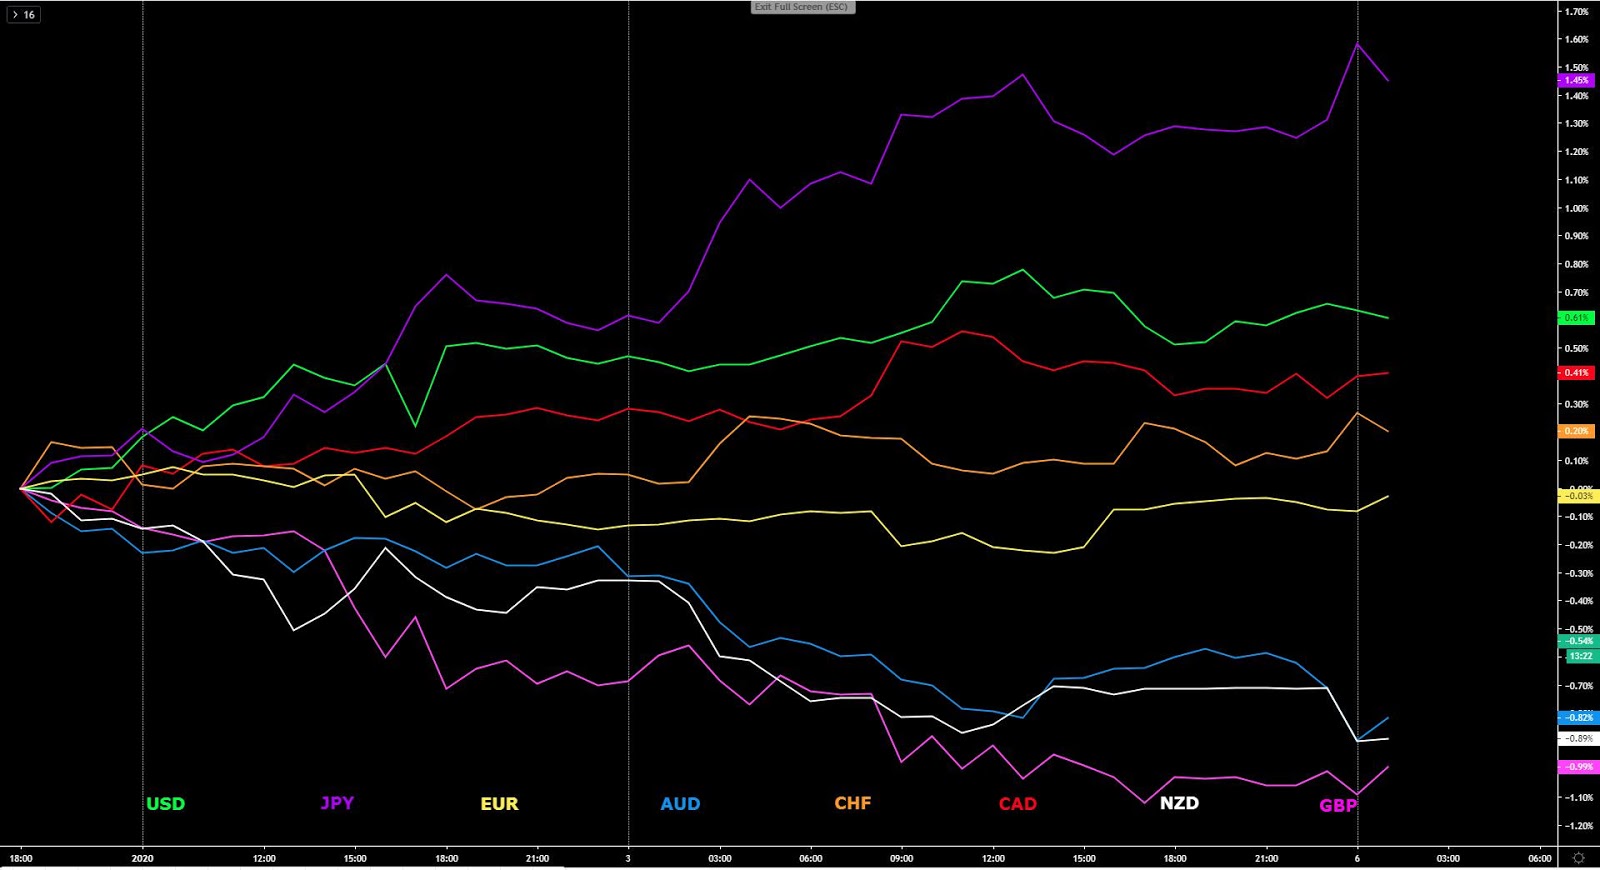
The entrance of a new decade has brightened up the outlook for the Japanese Yen as geopolitical tensions between the US and Iran have resulted in a swift transition into risk-off dynamics dominating the proceedings in the forex market. On the other end of the spectrum, we find the Oceanic currencies and the Sterling as the worst performing amid the deleveraging off carry trades and tightening of financial conditions as both equities and bond yields fell in tandem globally last Friday. The US dollar has been greeted with positive flows to start the year and so far has been able to capitalize on these risk averse conditions, with the extra backing of January’s seasonal pattern (best month of the year by far) also starting to pan out in favor of the world’s reserve currency. The Canadian dollar, assisted by benign fundamentals and technicals at an index level, alongside its correlation with USD positive flows, is also taking advantage of the wave of buying pressure in the USD, even if it still exists a major contrast in the technical outlook between the two of them, in favor of the CAD. The EUR and CHF are virtually unchanged from the levels quoted to start the year, as the chart below shows, even if readers should be made aware that this is typically a very rough month for both currencies from a seasonal perspective, which in the case of the EUR, is backed up by the bearish market structure.
Narratives In Financial Markets
* The Information is gathered after scanning top publications including the FT, WSJ, Reuters, Bloomberg, ForexLive, Institutional Bank Research reports.
Risk off dynamics to start the year: A lively start to the Asian session as the focus continues to orbit around the escalation in the US-Iran geopolitical tensions following the death via a drone-initiated airstrike of Iran’s top military leader in Baghdad. This event set out a risk-off tone in markets since last Friday which still continues.
Trump keeps hard-line stance against Iran: Trump gave a brief press conference , in which he reaffirmed his conviction that the strike against the Iraninan leader Soleimani was the right call to make given the imminent plotting of attacks on US diplomats and military. Trump said “we took action to stop a war, we did not take action to start a war”, and that “we do not seek regime change.”
Iran vows to retaliate the US offensive: The headlines dripping through are not encouraging as Iran says it will no longer observe limits on its uranium enrichment, according to Iranian State TV (Fars News Agency ), in a report carried by Reuters. Iran’s uranium enrichment work will have no limitations, Tehran will enrich uranium based on its technical needs. This is undoubtedly concerning as the fear is that the stock of uranium may be used for the wrong purposes such as building up the country’s nuclear bomb capabilities.
Minor attacks have followed, Iranian linkage: There have been reports of rocket attacks in the Green Zone near the US embassy in Baghdad, according to Sky, noting that multiple rockets/mortars hit the vicinity of the US embassy, with no casualties reported so far. Additionally, a US service member and 2 US Defense Dept contractors were killed in an airfield used by U.S. military in Kenya. Both attacks are thought to be linked to Iran. Trump has warned that the US will strike back, perhaps disproportionately.
Iraq wants US troops out of the country: The Iraq parliament has voted to boot out the US military personnel from the country, even if this decision is conditional to the legitimacy of Iraq's caretaker government to have the actual authority to expel the US, as well as the prime minister needing to sign the bill into law. Qais al-Khazali, the commander of an Iran-backed Iraqi militia, said that if U.S. troops do not leave Iraq, they would be considered an occupying force.
Watch for risk-off fade out as war unrealistic: If history is any indication, this conflict between the US and Ira may end up being a short-term side show before the market refocuses on new drivers. In other words, excessive risk-off may sooner than later not be justified based on unrealistic scenarios of war priced in. If Iran were to ever engage in a full-blown war with the US, it would be a suicidal act. Most likely, we will see some temporary rattling and minor attacks by Iran to save face in front of his people.
US Dec ISM manuf lowest since 2009: The US Dec ISM manufacturing came at 47.2 vs 49.0 expected, which is the lowest since June 2009. As a minor consolation, it’s worth noting that the US-China trade truce is yet to be fully captured by this month's data. Timothy Fiore, Chair of the Institute for Supply Management, detailed that “global trade remains the most significant cross-industry issue, but there are signs that several industry sectors will improve as a result of the phase-one trade agreement between the U.S. and China.”
The FOMC minutes sticks to its usual script: The Fed published its latest minutes from the Dec policy meeting last Friday, noting that rates are likely to remain appropriate for some time unless there's a material change. According to the main headlines, the Fed saw risks to outlook as tilted to the downside but that some risks had eased in recent months, and that a more sanguine view of risks is now emerging as a result of easing US-China tensions, along with a lower probability of no-deal Brexit. Topics for future discussion included composition of long-term Treasuries in holdings, with a transition away from active repo operations in mind.
Insights Into FX Index Charts
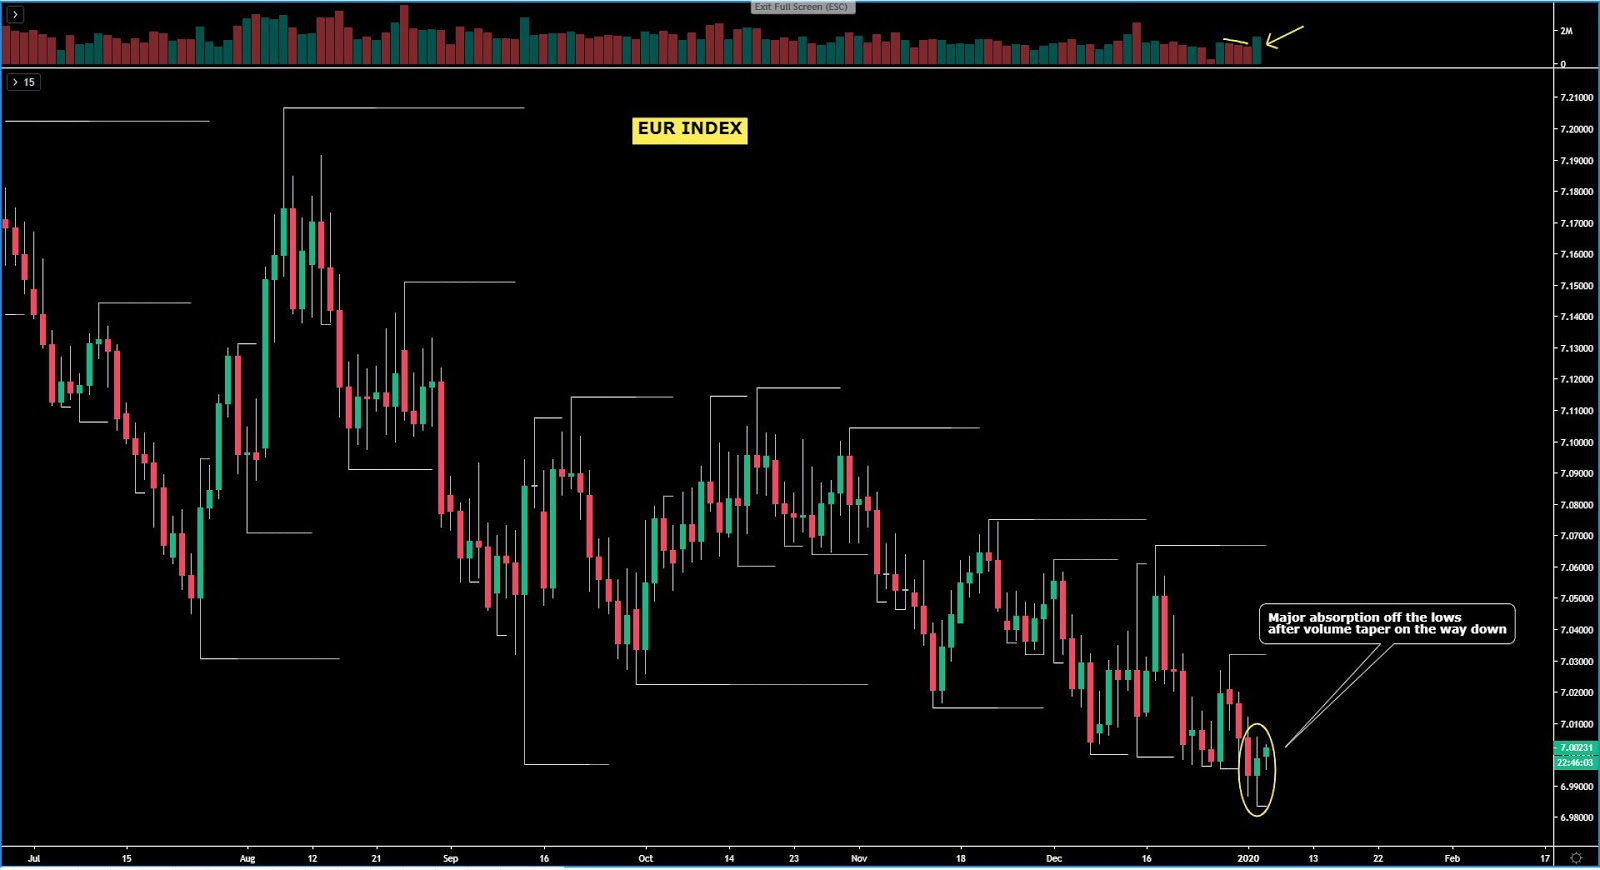
The EUR index broke into fresh multi-year lows to start the year only to see an abrupt reversal rejecting the low quotations as the risk-off market profile exacerbated. Technically, the euro index portrays a bearish trend as per the lower lows and lower highs printed, even if the sizeable buy-side volume off the lows (largest since mid Oct ‘19) implies that further room for a recovery may be in store, especially after the bearish leg was produced on volume tapering. Bear in mind though, the seasonal pattern for the EUR in January is very poor, accumulating, on average, losses of -0.81%. This makes the prospects of a substantial recovery dubious at best.
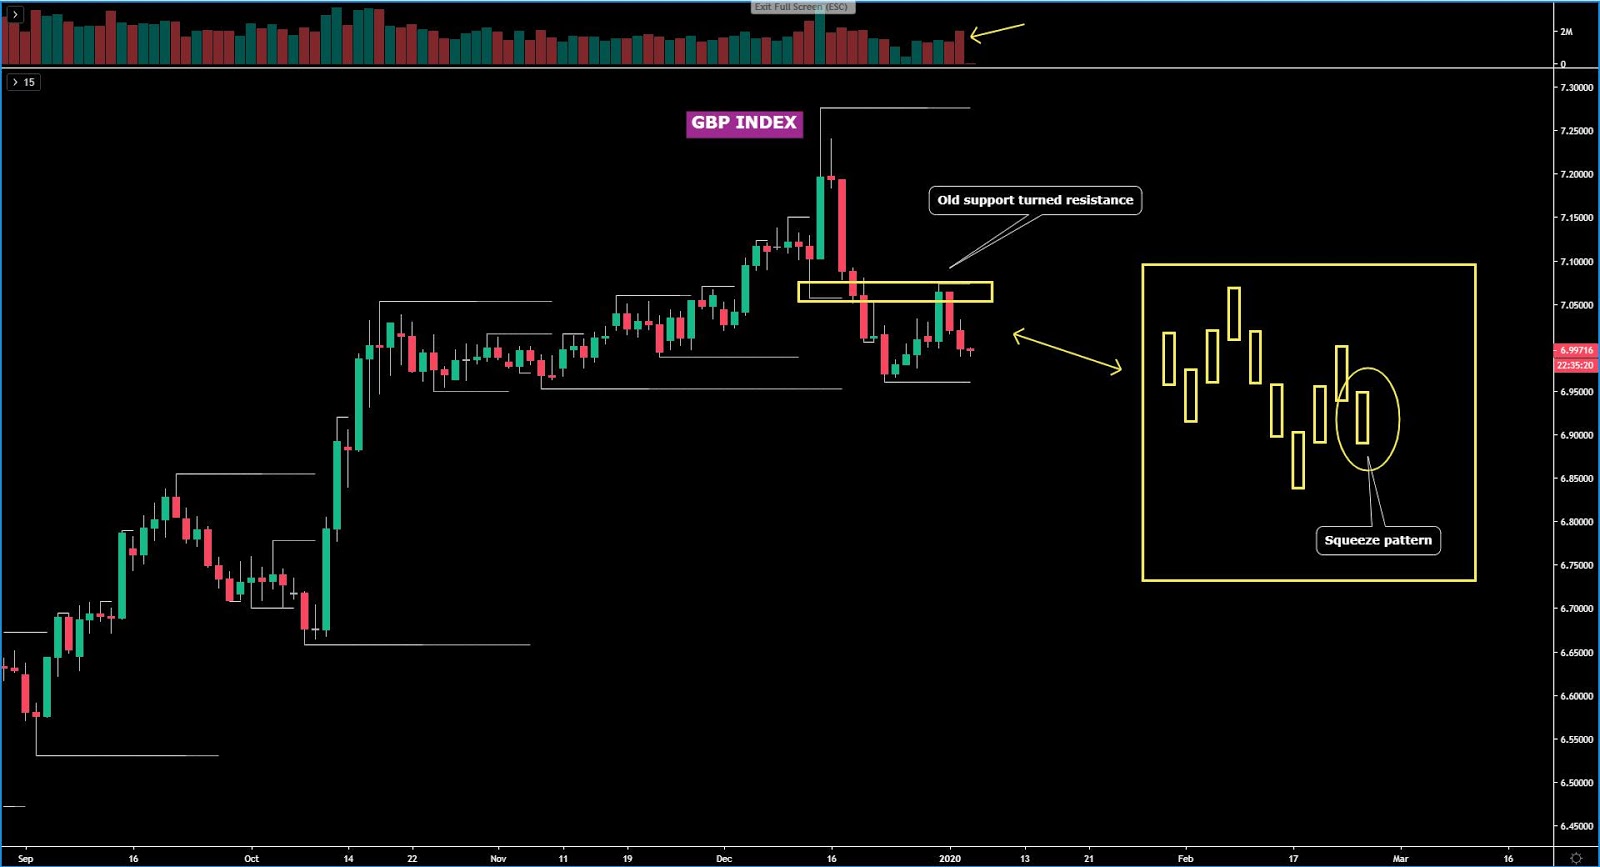
The GBP index looks set to keep auctioning lower towards a retest of the prior swing low judging by the technical storyline. After the decisive breakout of the Dec 12th low, which invalidated the bullish structure in this market, there has been further evidence that sellers remain committed to add short GBP inventory on the way up by rejecting higher prices. The actual pattern currently at play has high odds of at least extending towards the most recent lows in what would be characterized in the forex jargon as a squeeze trade where weak-handed buyers get run over. The seasonal pattern for the GBP is not encouraging either, averaging losses of -0.45% in Jan.
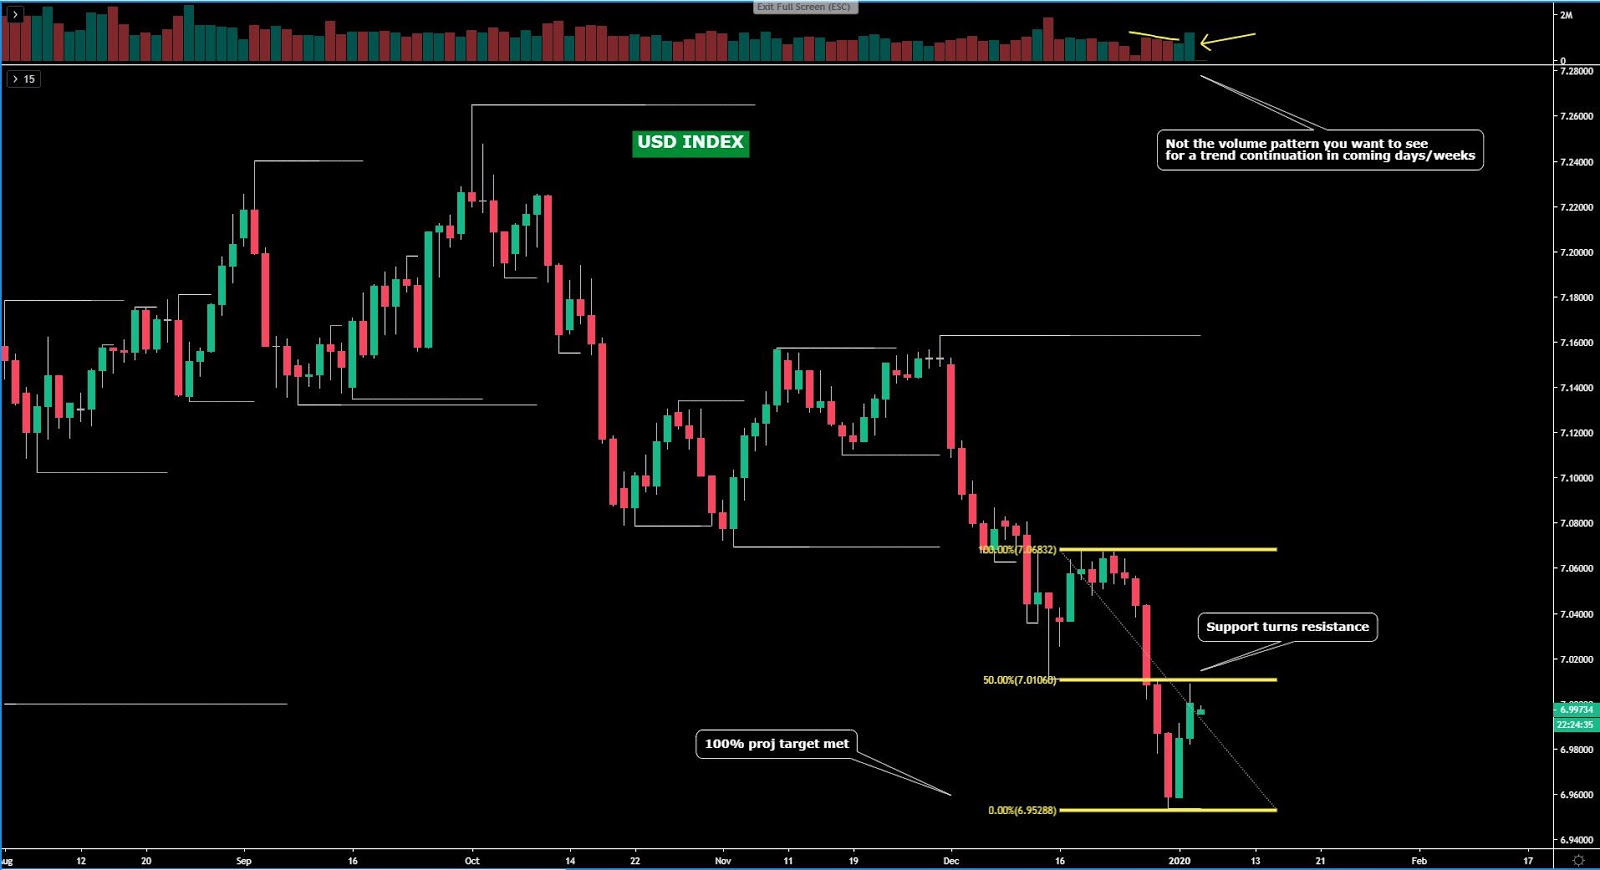
The USD index, unlike the previous successful bearish legs, it shows a lack of commitment by sell-side accounts based on the tick volume printed. The most recent impulsive leg down has come about in what I tend to dub as a false acceleration given the absence of tick volume backing up the sizeable extension that came as a result. Besides, the recovery displays the opposite pattern, with volume picking up. Note, the last leg down came to a halt at the 100% proj target to the pip before buyers stepped in. Technically, the index remains bearish, but with seasonal patterns favoring USD longs this month (January tends to be the best performing month of the year for the USD) and the trend overly extended, be on the lookout for potential long USD opportunities, even if it’s still very premature.
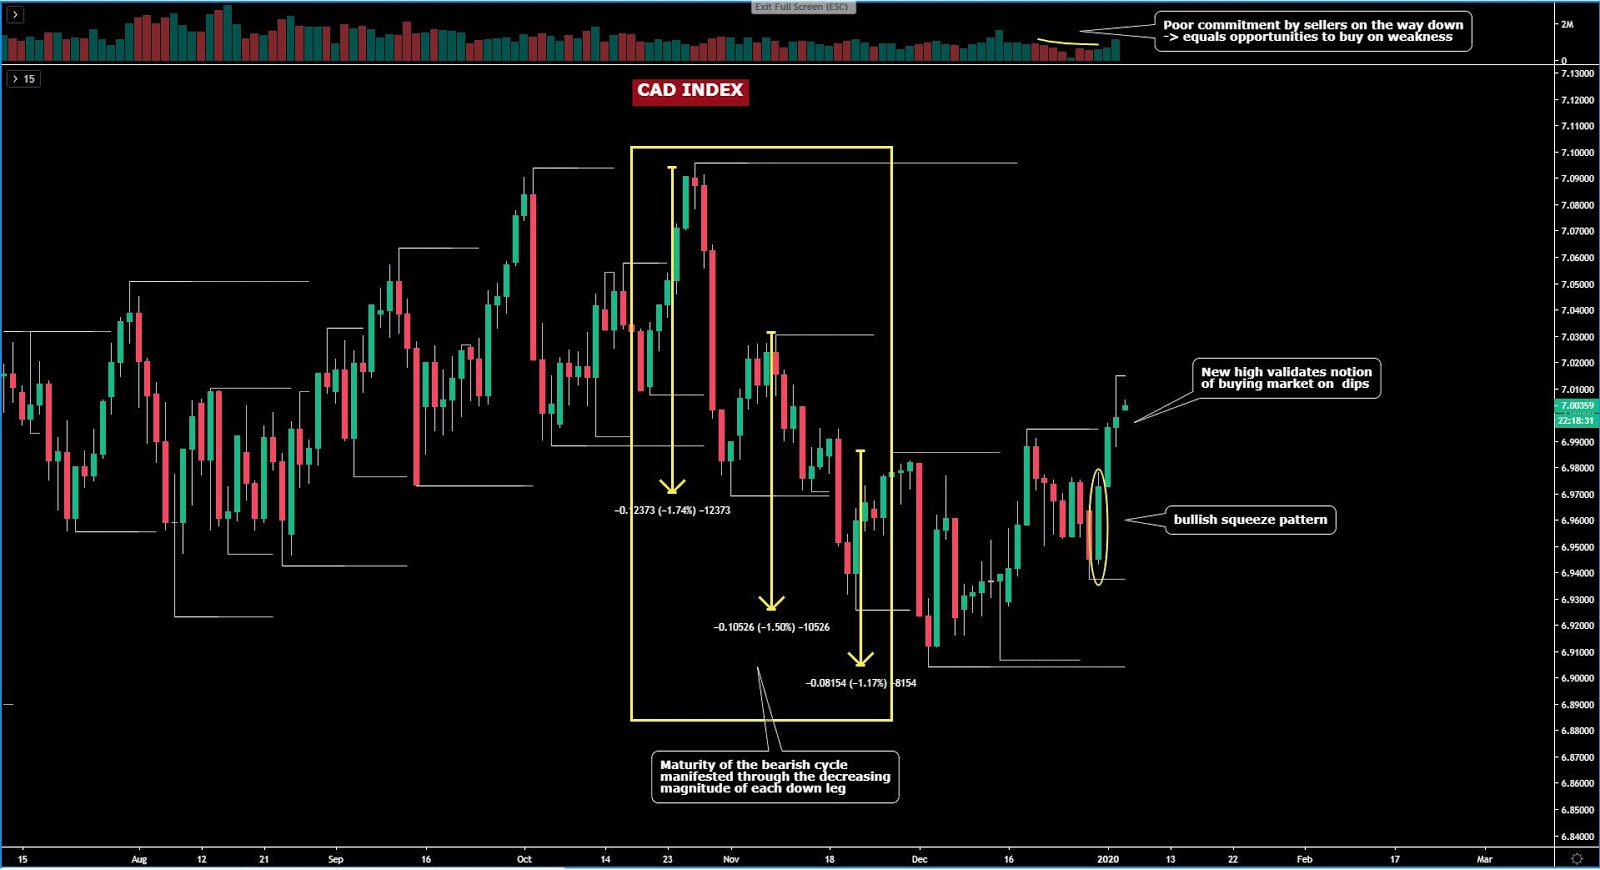
The CAD index, ever since mid Dec, I endorsed the vision that we were is in the midst of transitioning into higher levels judging by the market structure, one that was finally validated the 3rd week of Dec through the break of the prior swing high. Once the shift in market structure occurred, I left customers the following note: “We should let the market go through a retracement to provide us more value to be a buyer at cheaper price levels.” That is precisely what’s pan ot ever since, with the low volume pullback confirming that sell-side activity was non--committal and that buyers were lurking nearby to extend the rally. The case for a protracted bullish bias into January is my base case, with technicals and fundamentals in congruence as two positive factors that anchor the currency. The seasonals for the CAD are also positive, averaging over 0.33% of gains in Jan for the past 36 years.
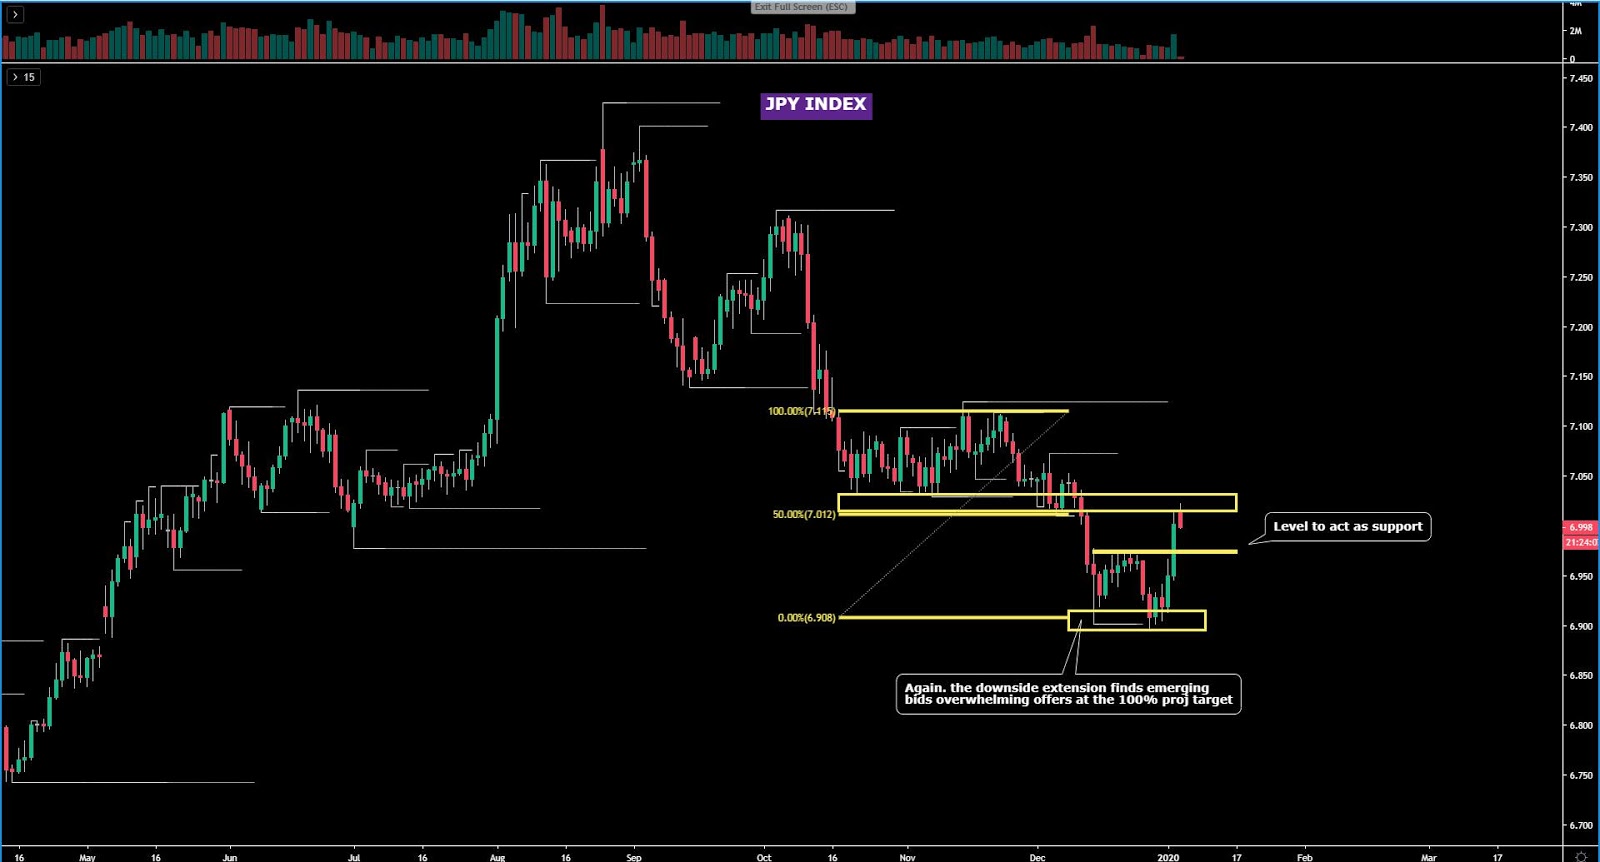
The JPY index has rocketed northbound as the market resorts to the safety of the funding currency at times of escalating geopolitical tensions in the Middle east. That said, if you maintain the overall macro bearish view in the currency, the area tested at the Asian early doors represents a very good attractive location to ponder some bearish ideas in the Yen given the significance of the resistance being tested (most relevant support in Q4 ‘19). The momentum is still in favor of JPY longs but the room for further gains looks limited. The seasonal pattern for the currency is more positive than negative, averaging +0.25% in Jan since Jan ‘82.
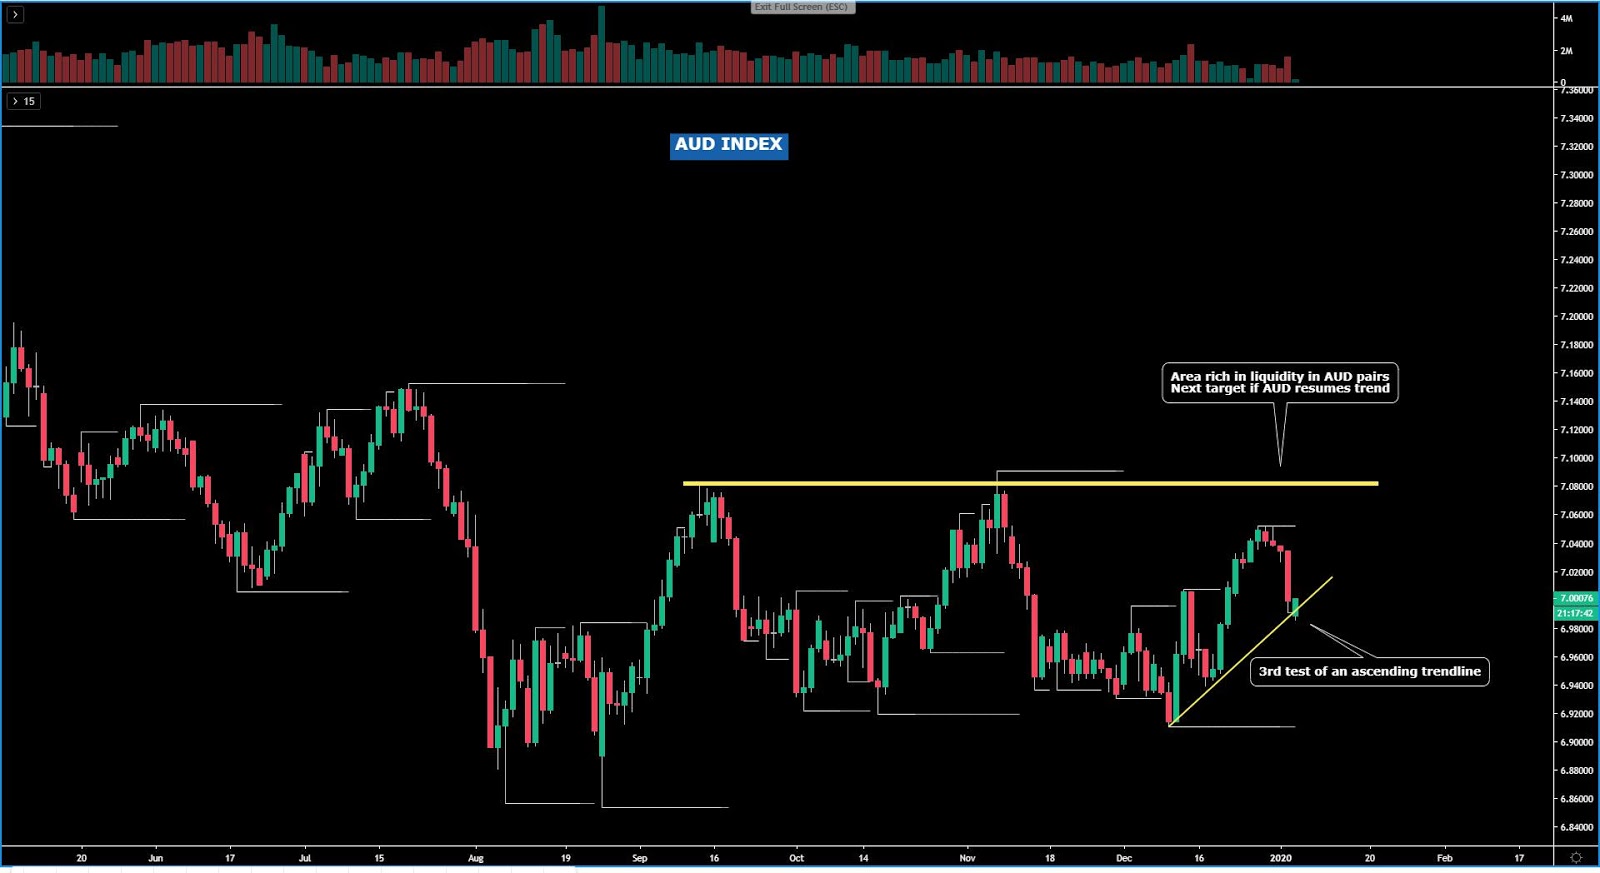
The AUD index has come into contact with the 3rd test of an ascending trendline as part of a bullish structure context as per the higher highs and higher lows printed since mid Dec. Should an adjustment to more benign risk conditions ensue, the Australian dollar, technically wise, looks well positioned to attract buy-side business. Note, the current bullish cycle, with only 2 legs up, appears to be incomplete, which is why this location represents a genuine opportunity to consider long positions in the AUD vs the weakest links upon one’s own entry triggers. On top of that, the forex seasonal pattern is positive to the tune of +0.54% in Jan.
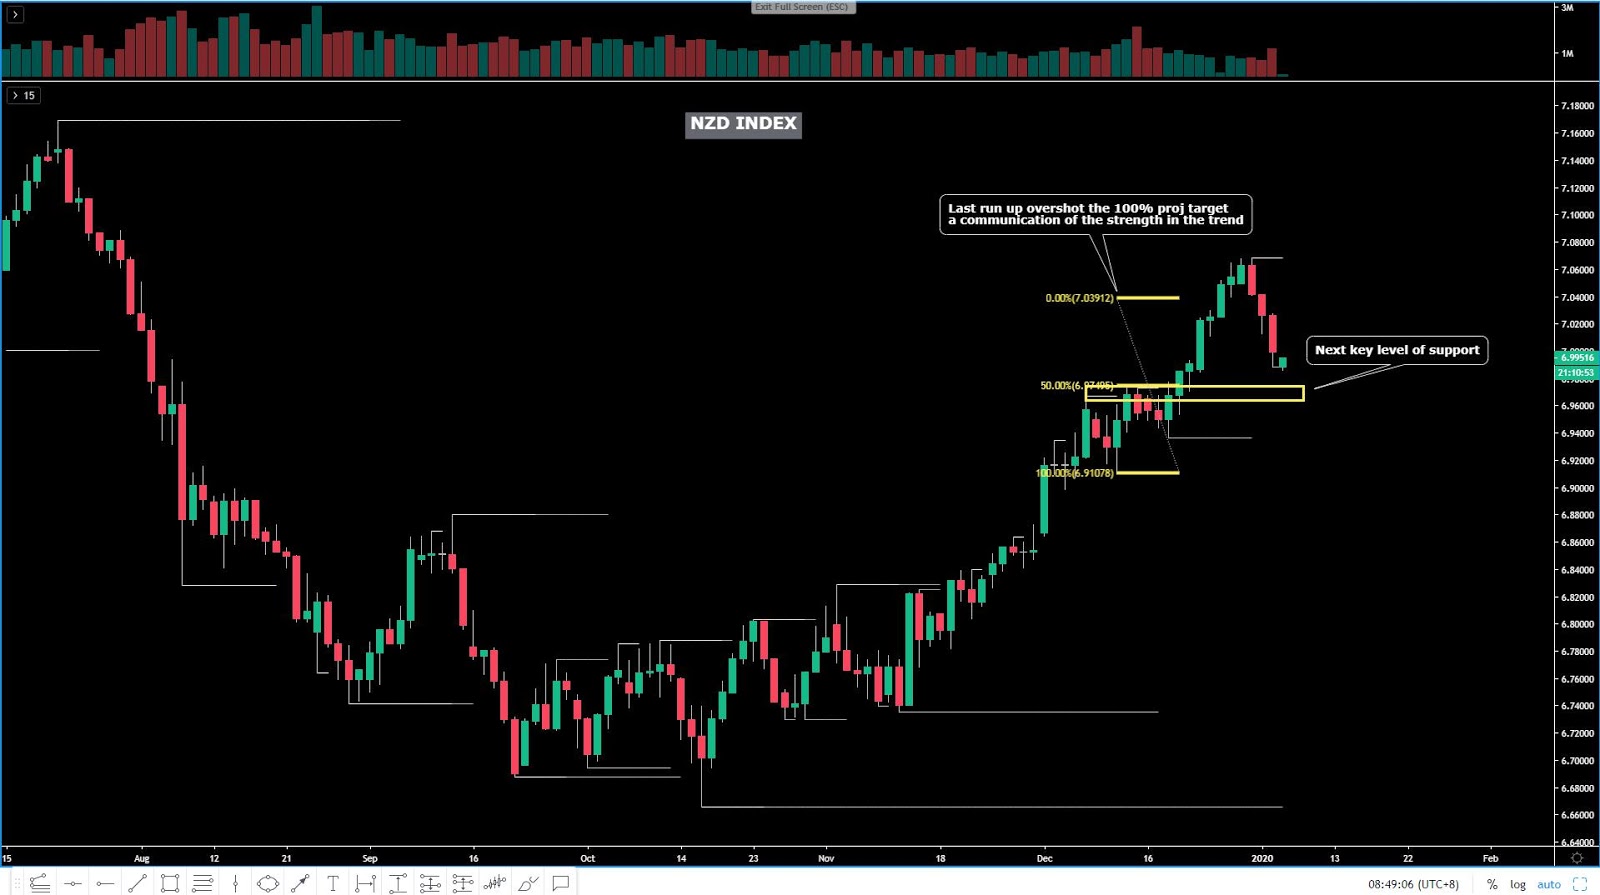
The NZD index, while falling for 3 days in a row, does not justify to retain a bearish bias off the daily as the market structure remains clearly bullish. I’ve highlighted in the chart below the next key level of support where the currency may see buyers re-grouping. It remains a dangerous proposition to stay overly bearish committed in what’s proven to be the most pronounced and protracted trend in the G8 FX space in Q4 ‘19. It’s going to take more than just geopolitical headlines to revert this trend. As I point out in the chart, a measurement of the strength in the NZD trend is the fact that the last run up overshot the 100% proj target.
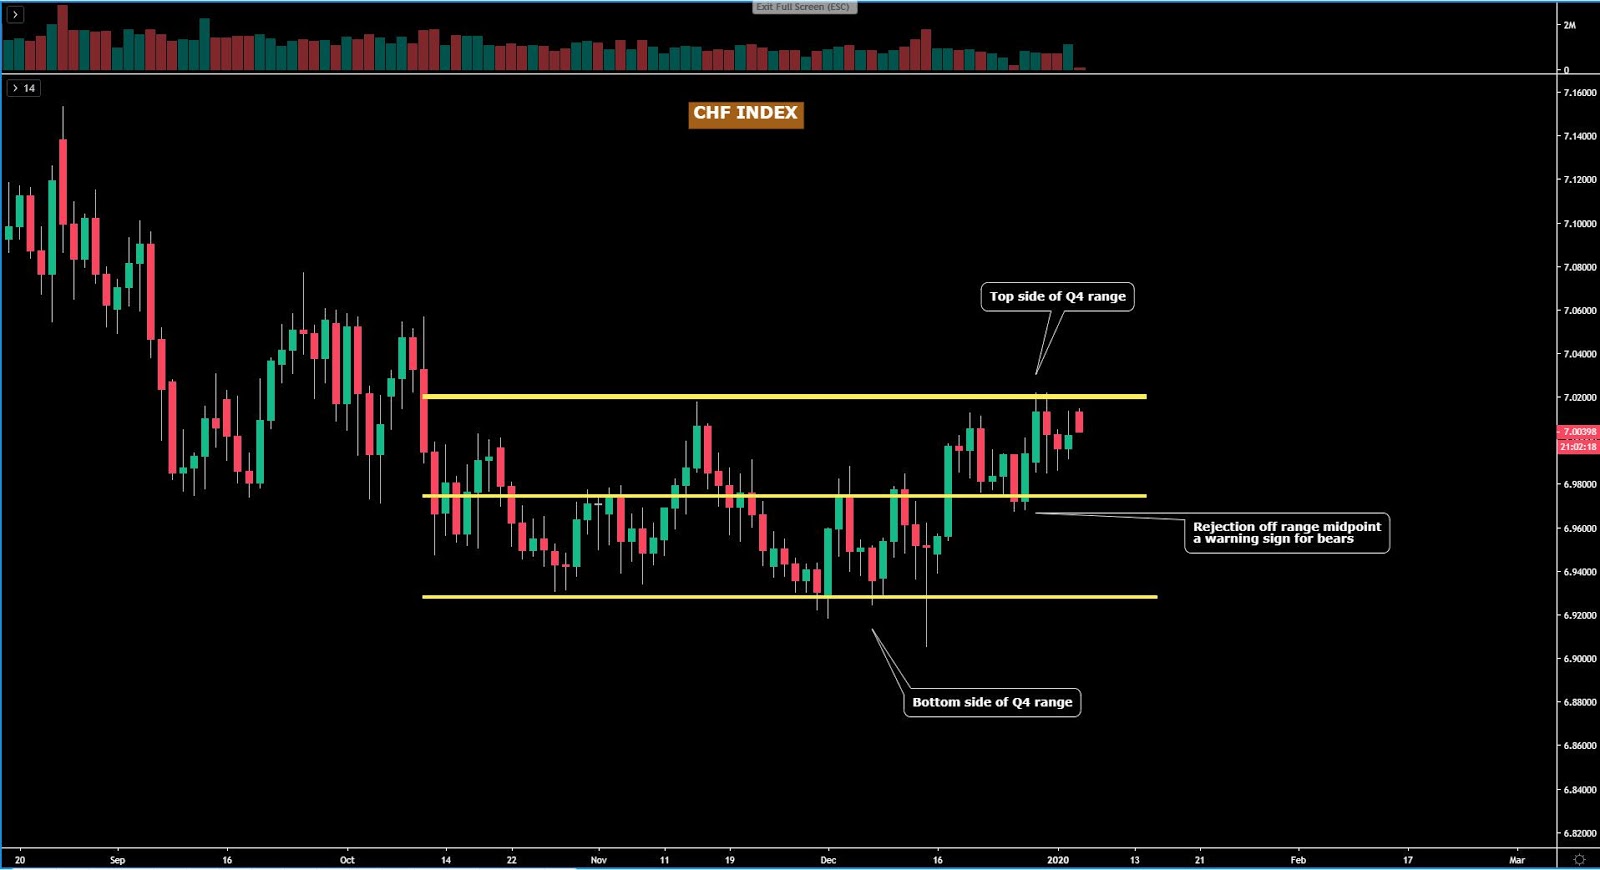
The CHF index has been lifted to fairly elevated levels as the pricing flirts with the topside of its last quarter’s range, making the location an appealing one to ponder shorts. Sooner or later, unless the market goes on a protracted risk-off mode, the CHF faces the clear risk of being sold as a result of the funding characteristics it offers (negative swap), which makes the currency a potential favorite candidate to act as counterpart on an increase of carry trades. The forex seasonals for CHF are not backing the bullish trend either, with losses averaging 0.53% in Jan. As a cautionary note, the rejection off the midpoint of the range suggests buyers are willing to pay higher prices, which makes the prospects of a topside breakout a scenario not to be ruled out.
Important Footnotes
- Cycles: Markets evolve in cycles followed by a period of distribution and/or accumulation.
- Horizontal Support/Resistance: Unlike levels of dynamic support or resistance or more subjective measurements such as fibonacci retracements, pivot points, trendlines, or other forms of reactive areas, the horizontal lines of support and resistance are universal concepts used by the majority of market participants. It, therefore, makes the areas the most widely followed and relevant to monitor.
- Trendlines: Besides the horizontal lines, trendlines are helpful as a visual representation of the trend. The trendlines are drawn respecting a series of rules that determine the validation of a new cycle being created. Therefore, these trendline drawn in the chart hinge to a certain interpretation of market structures.
- Fundamentals: It’s important to highlight that the daily market outlook provided in this report is subject to the impact of the fundamental news. Any unexpected news may cause the price to behave erratically in the short term.
- Projection Targets: The usefulness of the 100% projection resides in the symmetry and harmonic relationships of market cycles. By drawing a 100% projection, you can anticipate the area in the chart where some type of pause and potential reversals in price is likely to occur, due to 1. The side in control of the cycle takes profits 2. Counter-trend positions are added by contrarian players 3. These are price points where limit orders are set by market-makers.
