President Trump has been talking about building a wall between the US and Mexico for over a year. As time has moved on in his young presidency, that talk has slowed. But the Mexican’s have not stopped thinking about it. In fact the Mexican stock market has been plodding higher and is now at its own wall – ready for a break out.
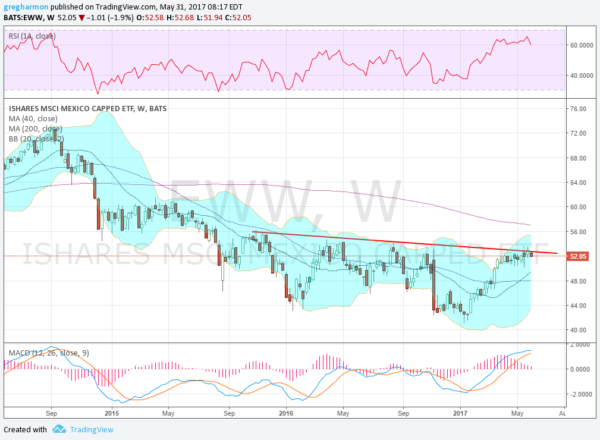
The chart below shows the Mexican ETF (NYSE:EWW) over the last 3 years on a weekly basis. After falling from a top in the summer of 2014 it started to slow the slide in late 2015. Since November 2015, it has slowed to a trickle, lower against falling trend resistance. It made a lower low after the November elections, but is now back at that resistance. Will it break down the wall and push higher?

Momentum indicators offer a bit of a mixed story. The RSI is at 2-and-1/2 year highs, but in the short term it's testing a move lower. The MACD is also at highs but leveling, showing a waning momentum. The price has also stalled far below the 200-week SMA, although it is above the 200-day SMA (40 week), which is a bullish indicator.
The wall has come into play in a different way in Mexico. A break above it could easily see a 10-15% move to the upside. But rejection at the wall would suggest a continued trickle lower and a new low 15% below. Keep an eye on the wall.
