The state of US trade with Mexico is on the front page as policy makers attempt to stem the outflow of firms, jobs, and goods production from the United States. To put the issues in perspective, it is first helpful to have some facts on US trade in general and trade with Mexico in particular. By comparison with many countries, the US economy is still dominated by domestic production and consumption.
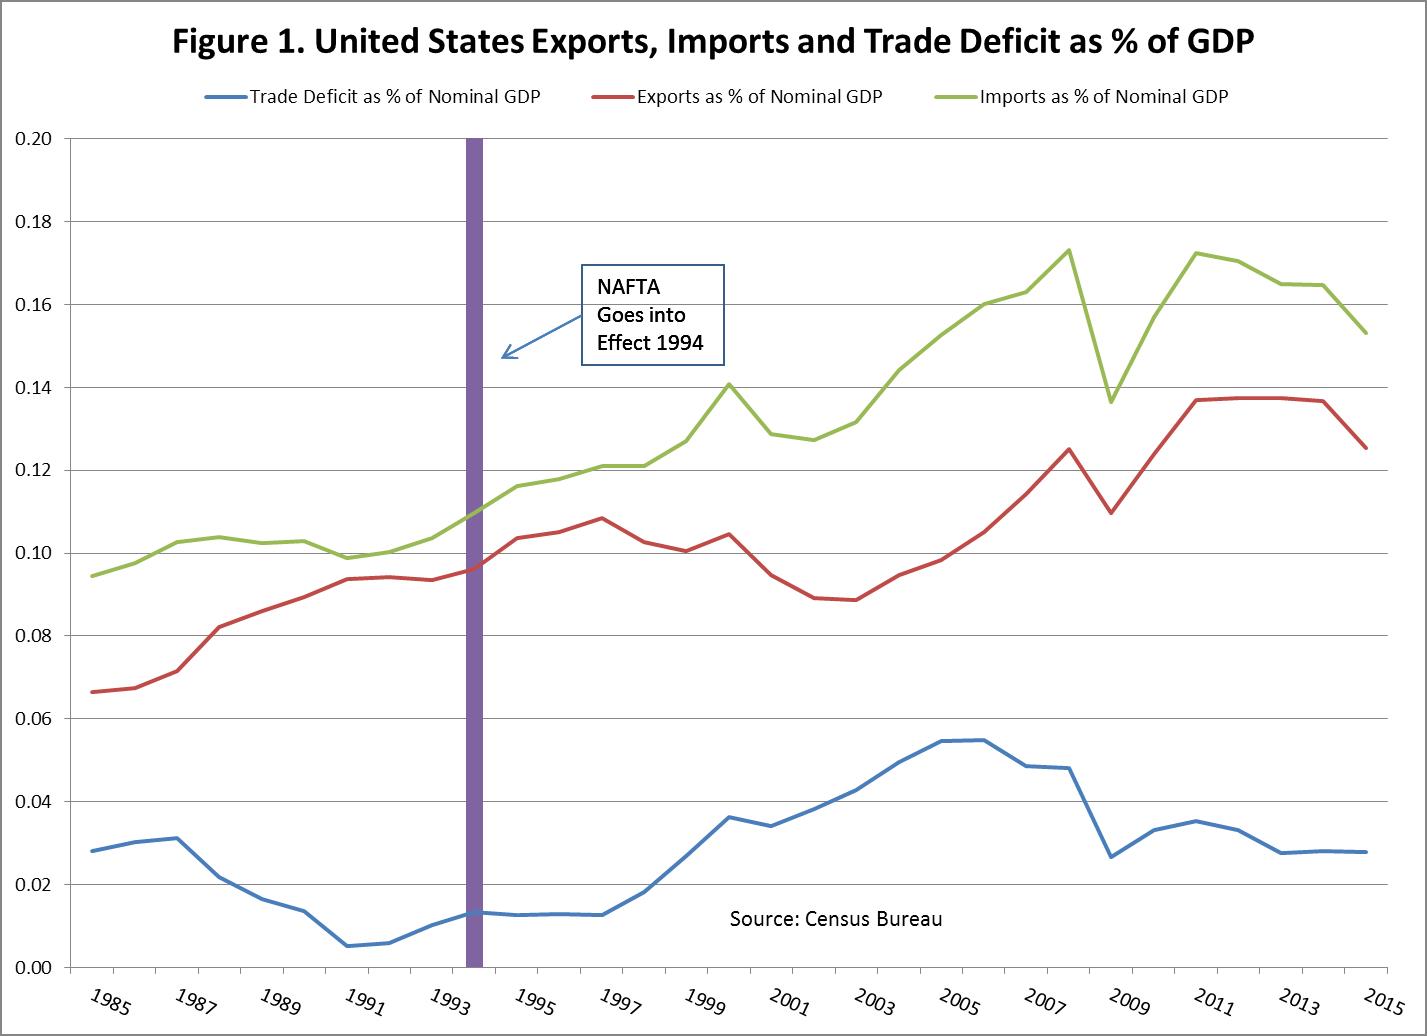
In the euro area, for example, trade amounts to about 69% of GDP, and in the UK it is about 38%. In the US economy, by contrast, exports amounts to less than 16% of GDP, and imports are only about 12.5% as of yearend 2015. Figure 1 shows the evolution of US trade since 1983. Our trade deficit in goods and services is slightly less than 3% of GDP in total, down from a peak in 2005 of slightly more than 5%.
Against this background, Mexico is the US’s third-largest trading partner (the other two are China and Canada), but trade with Mexico still accounts for only a small and steadily declining share of total US trade. In terms of jobs, in 2014 (the latest year for which estimates are currently available), the US Trade Representative estimated that goods traded accounted for about 953K US jobs and services for about 193K jobs. Figure 2 shows the sharp and continuing drop in US trade with Mexico; and, interestingly, there was no noticeable impact on that trend from NAFTA.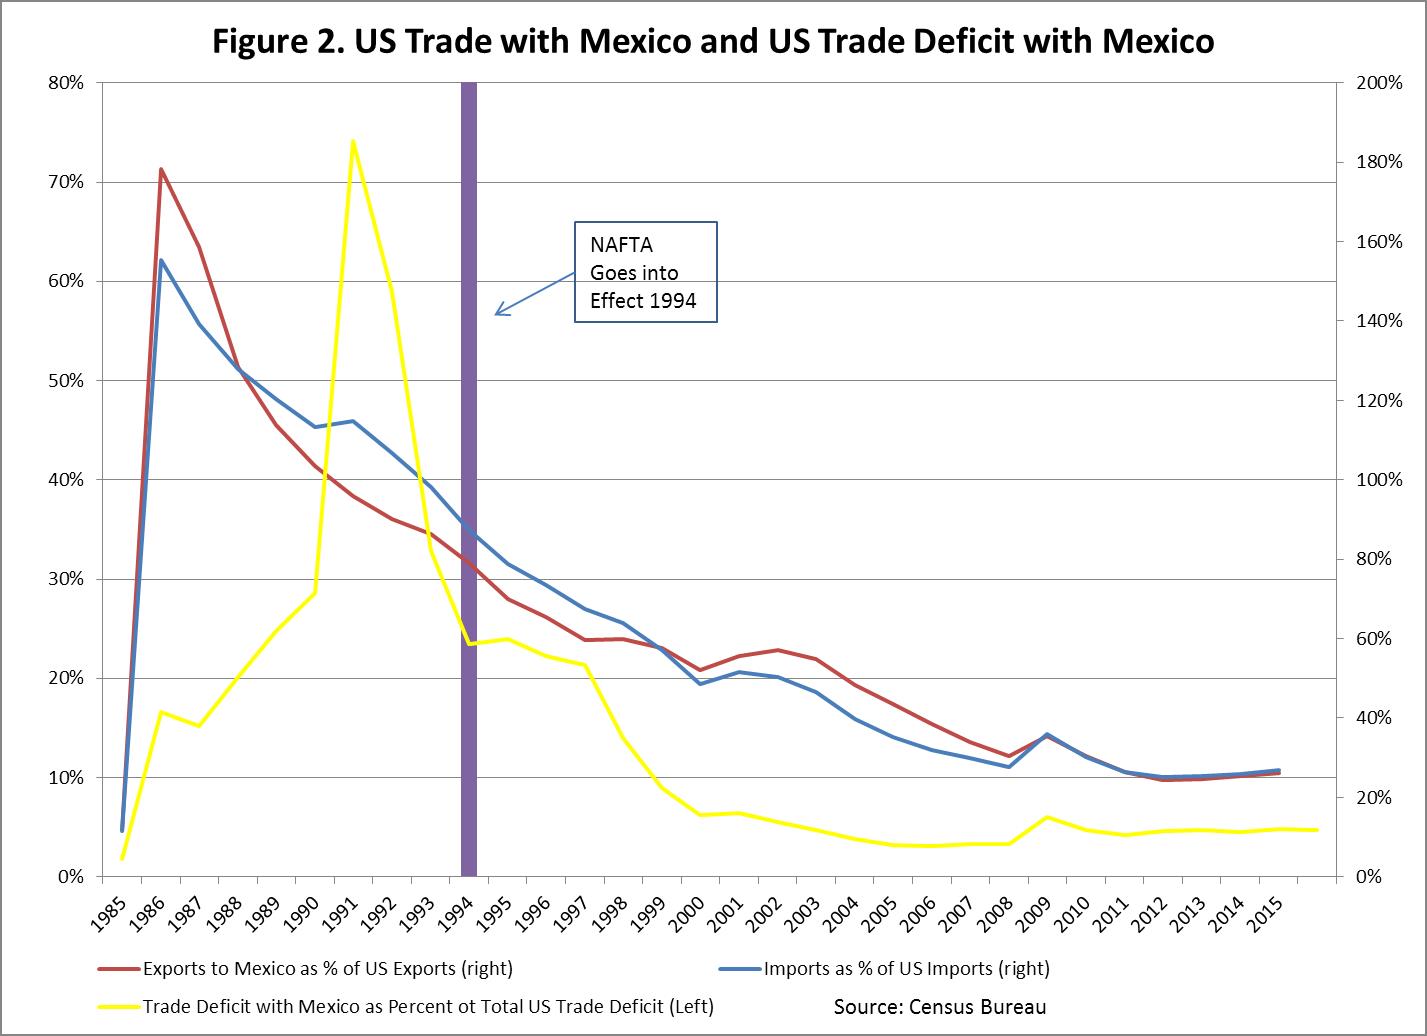
The chart also highlights the falloff in our trade deficit with Mexico, both as a percentage of GDP and as a percentage of our total trade. Figure 3 shows that our deficit with Mexico declined from a peak of slightly over 1.2% of GDP in 1986 to less than 0.2% in 2015. Again, there is no noticeable impact of NAFTA on either the size of the deficit or its downward trend.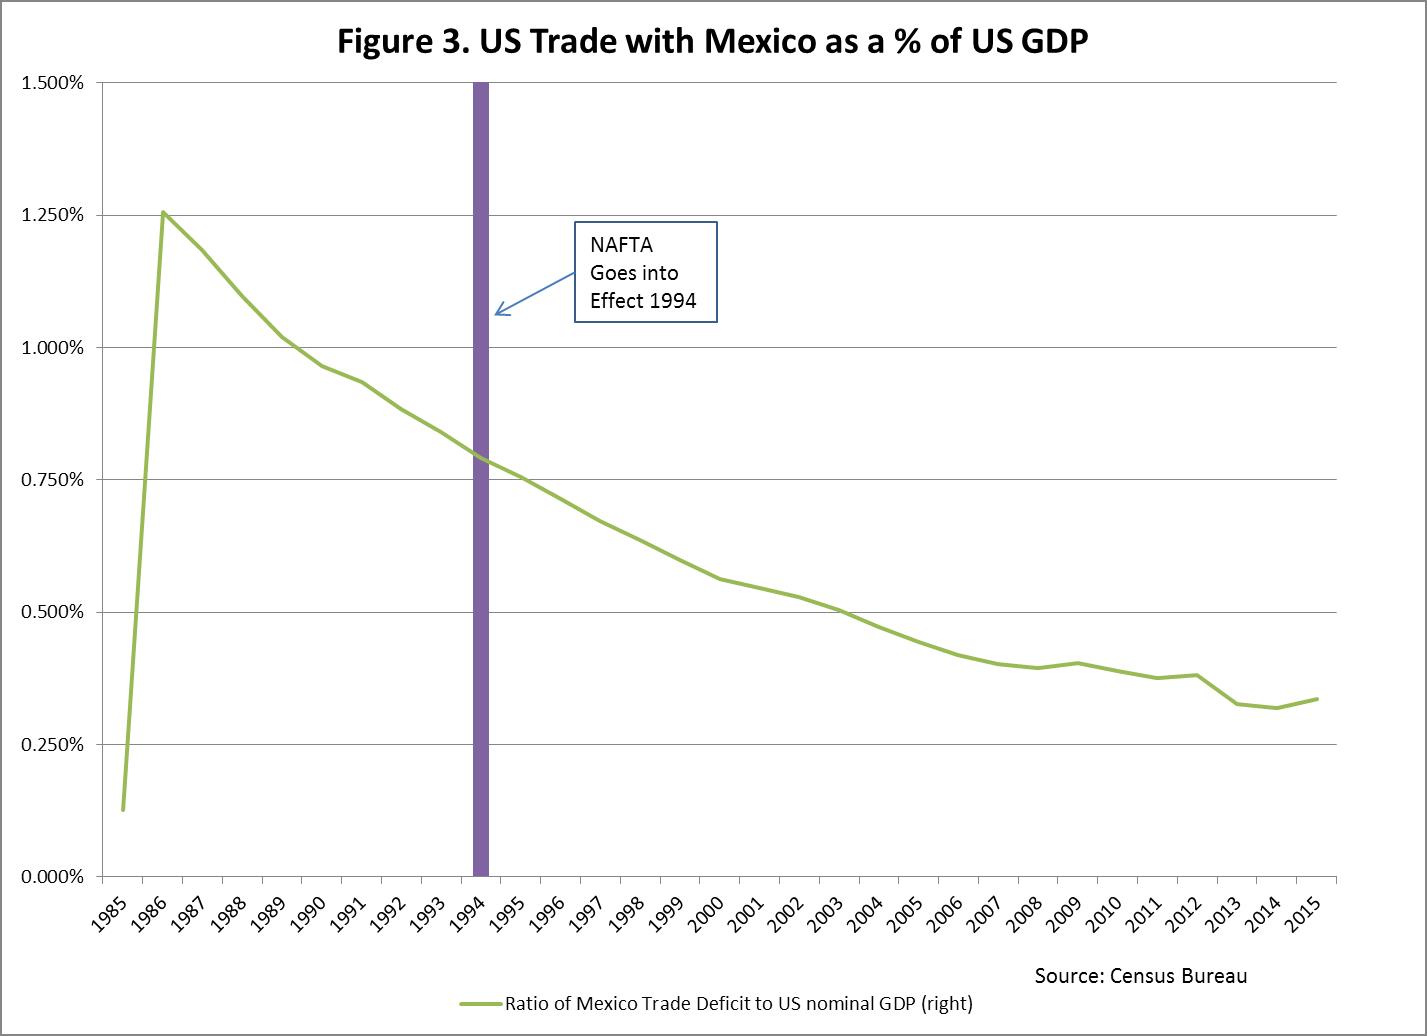
While the quantitative importance of trade with Mexico may be small relative to the size of the US economy, it is clearly more significant to Mexico. Its trade with the US account for half of its GDP, and its surplus with us accounts for about 5% of GDP.
Attempts to change the flow of goods and services across the US–Mexican border could have significant sectoral implications. The Office of the United States Trade Representative reports that most of the two-way trade between the US and Mexico is in goods. Table 1 shows a breakdown of the key goods and services that flow between the US and Mexico. The largest dollar volume of trade between the US and Mexico takes place in three key two-way trades – in vehicles, machinery, and electrical machinery. The main one-way US export to Mexico is in beef and beef-related products, while the main one-way imports from Mexico are in mineral fuels, optical and medical instruments, and agricultural products; and in the aggregate, these one-way trade flows are relatively small.
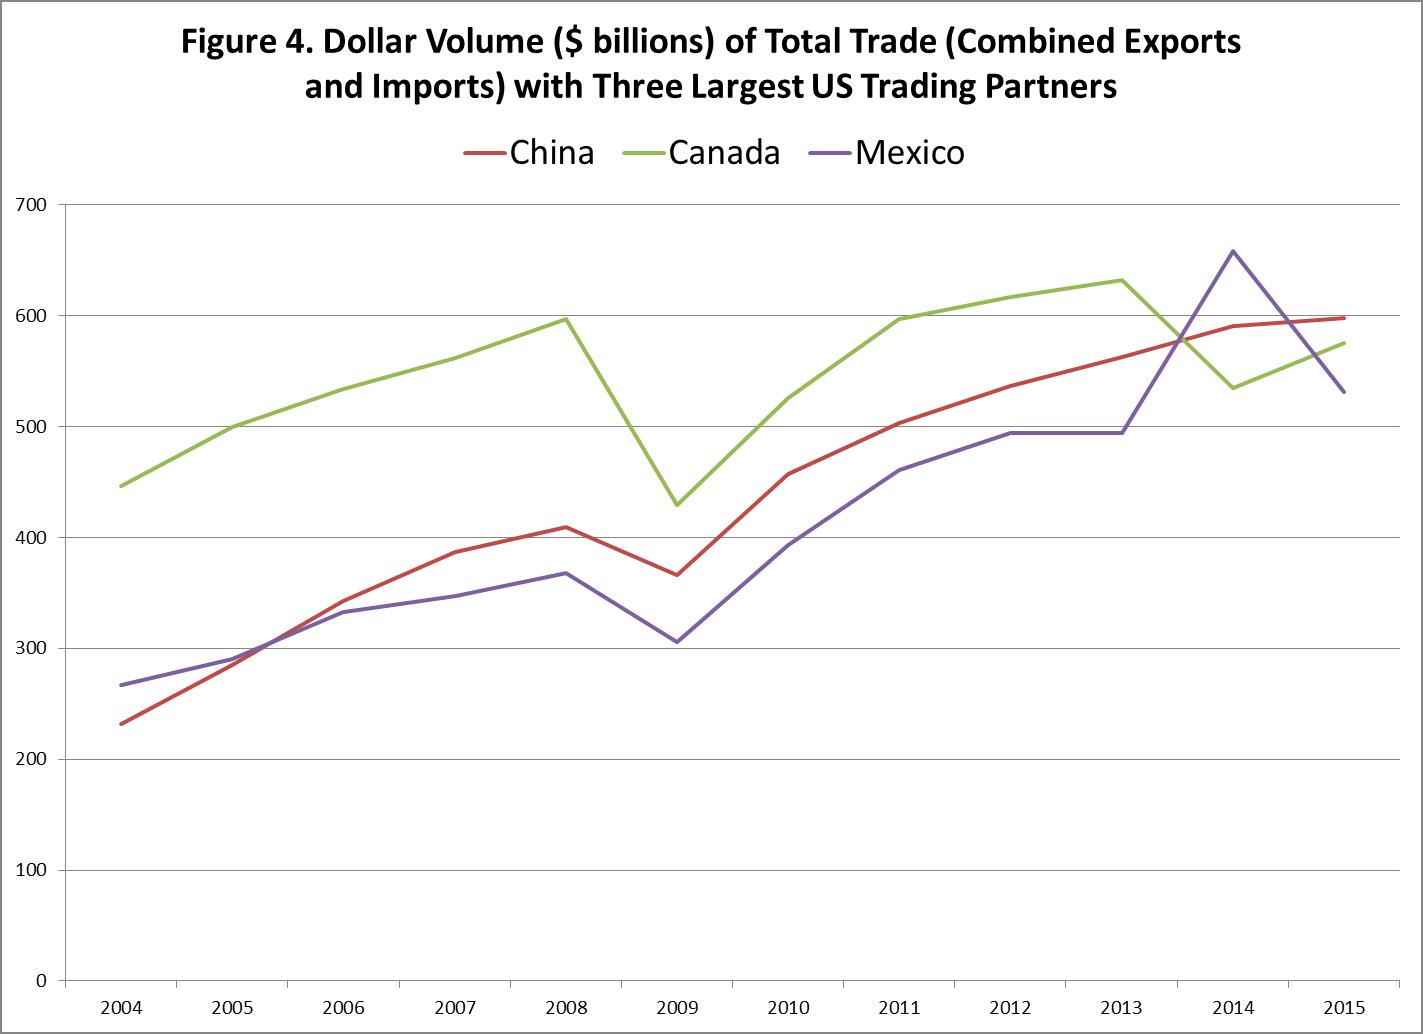
As mentioned earlier, Mexico is one of the three main US trading partners in addition to Canada and China. As Figure 4 shows, China has recently eclipsed Canada as the US’s largest trading partner; and together the three largest partners accounted in 2015 for 46% of US total trade (exports plus imports).
| Table 1. Composition of US Trade with Mexico – 2015 Source: US Trade Representative | ||
| US Exports | US Imports | |
| Goods | $ 236 billion | $ 295 billion |
| Services | $ 30.8 billion | $ 21.6 billion |
| Machinery | $ 42 billion | $ 49 billion |
| Electric Machinery | $ 41 billion | $ 63 billion |
| Vehicles | $ 22 billion | $ 74 billion |
| Beef and Beef Products | $ 1.1 billion | |
| Mineral fuels | $ 14 billion | |
| Optical and medical instruments | $ 12 billion | |
| Vegetables | $ 4.8 billion | |
| Fruits | $ 4.3 billion | |
| Wine and beer | $ 2.7 billion | |
| Snack Foods | $ 1.7 billion | |
| Processed Fruit and Vegetables | $ 1.4 billion |
Surprisingly, in the case of China, while the US does have a trade deficit of $366 billion, that deficit was only 2% of US GDP in 2015. Interestingly, our next largest dollar trade deficits, shown in Figure 5, are not with either Canada or Mexico but with Germany and Japan. Even these deficits are less than 0.5% of US GDP.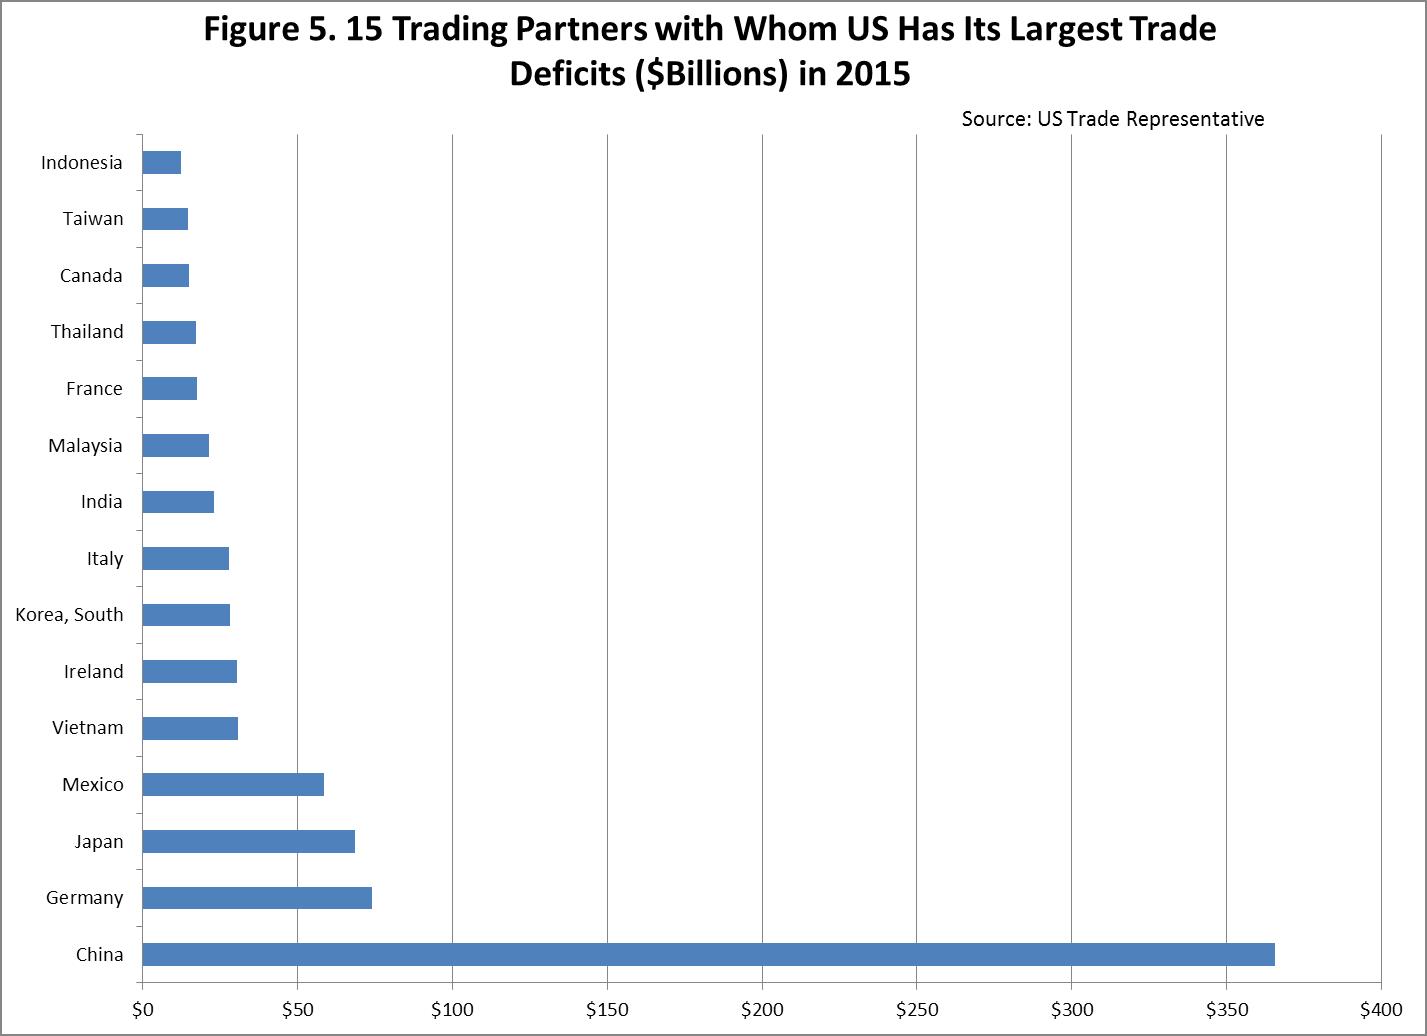
The US also runs surpluses, which totaled about $153 billion in 2015, with many other countries. As shown in Figure 6, our largest trade surpluses are not geographically concentrated, and are often with countries that are small in terms of GDP.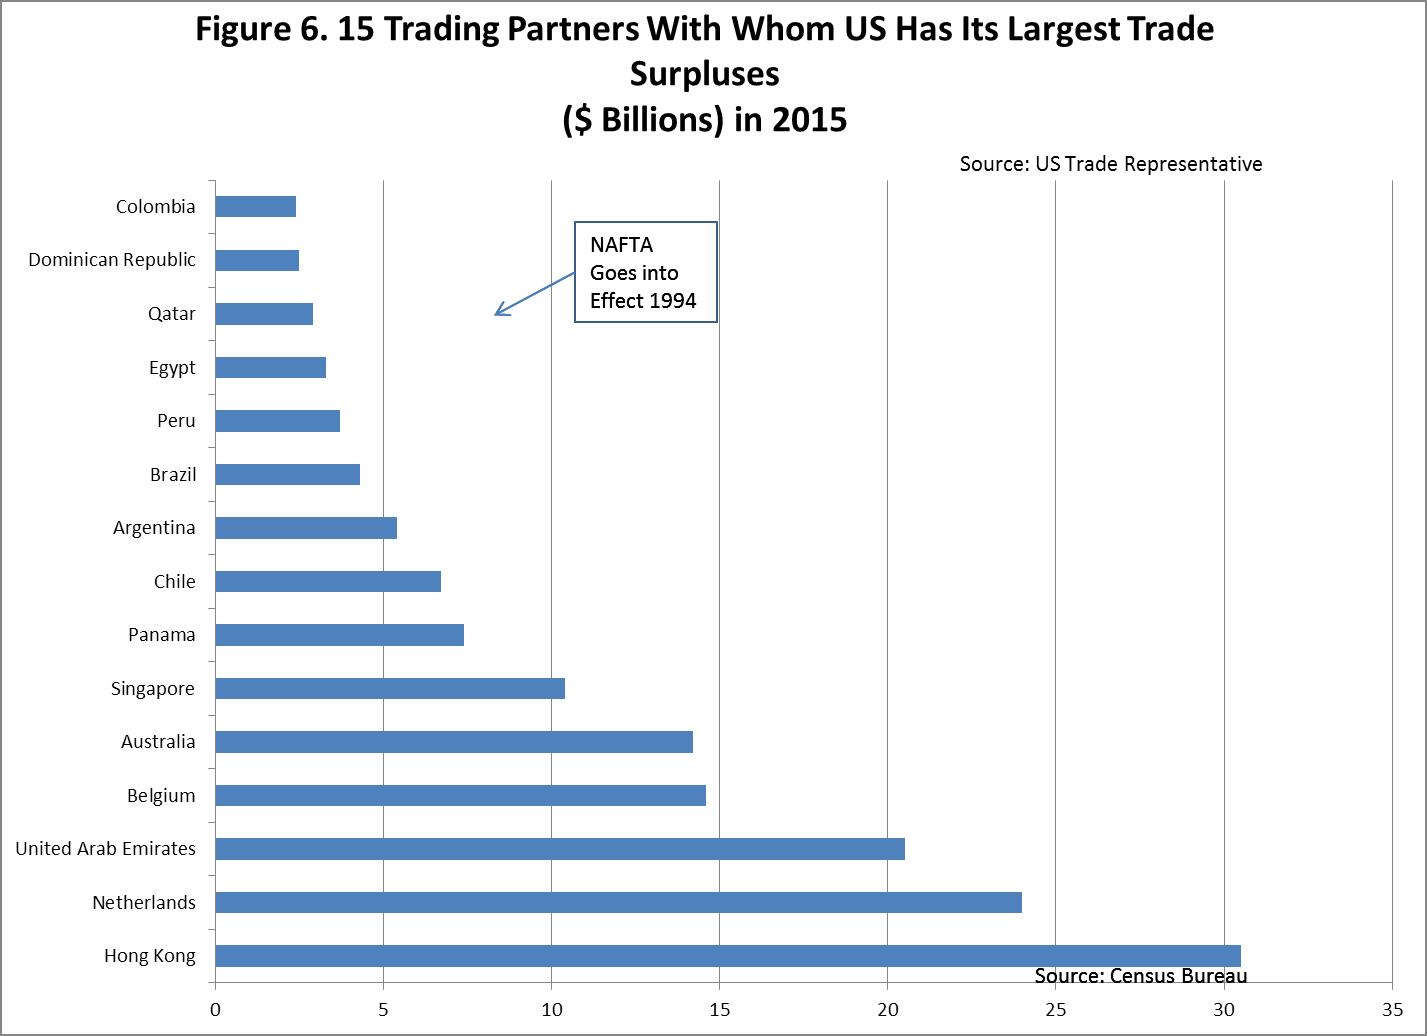
So what does all this mean for the current policy focus on trade, particularly with regard to NAFTA? First, in the data it is hard to see any direct effect on trade flows and deficits that can be attributed to passage and implementation of NAFTA. From a policy perspective, then, fixating on NAFTA may be tilting at windmills. Second, looking at specific trade flows between the US and our important trading partners, we see that our trade is country-specific rather than regional in nature.
Moreover, we tend to run continual deficits with some countries and surpluses with others. The theory of comparative advantage suggests that we should not aim to have a zero trade deficit with each country.
Finally, comparative advantage also implies that, in promoting US trade, efforts should be made to identify where the US has a comparative advantage in production of goods and services and to pursue policies that enable that trade. For example, the US has a clear comparative advantage in the production of certain agricultural products, yet protectionist policies are often pursued by other countries intent on keeping our products out. An effective policy towards agricultural trade would go a long way towards reducing the US’s trade deficit both with Mexico and the rest of the world.
