Gold, silver and mining stocks finally moved lower after several days of higher prices and one can say the opposite about the USD Index. Was this just a pause or a beginning of a bigger downtrend?
The latter is quite likely and the reasons come from the precious metals charts as well as from the one of the USD Index. In short, the points that we made in the previous alerts this week remain up-to-date, especially those that we discussed yesterday regarding the “when” factor. We will move to this issue in a few minutes and in the meantime, let’s start today’s discussion with gold’s short-term chart (chart courtesy of http://stockcharts.com).
Gold

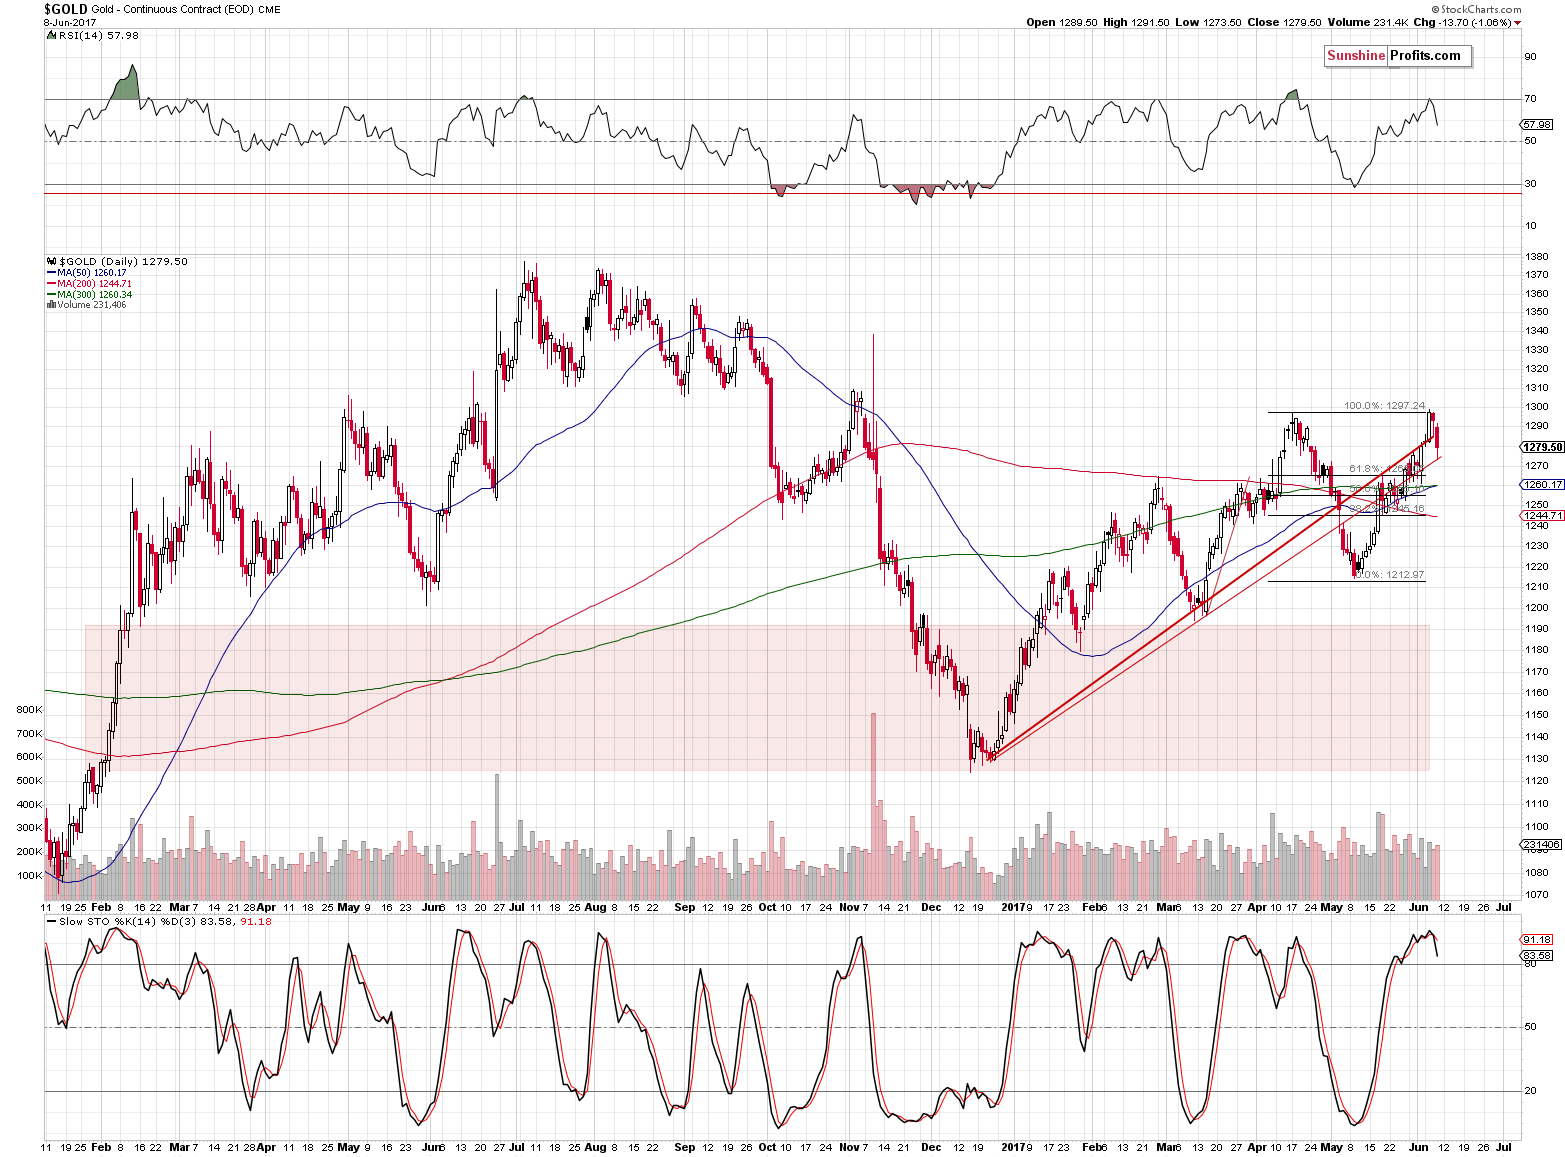
Gold moved visibly below the April highs and also below the rising red support/resistance line based on the daily closing prices. The breakout above it was therefore invalidated.
The RSI moved lower after reaching 70 and the Stochastic indicator flashed a sell signal by moving below its moving average.
In other words, the technical picture for the short term deteriorated based on yesterday’s session. The long-term picture has been bearish and it remains bearish today – yesterday’s session doesn’t seem to have changed much in that regard.

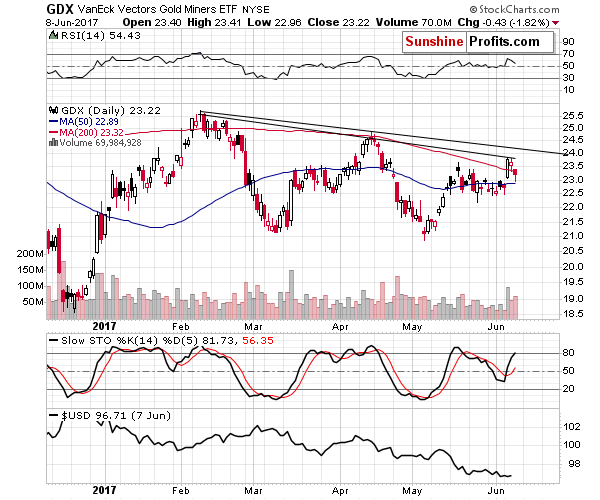
Mining stocks also moved lower on increasing volume, which is a bearish sign on its own. Another sign comes from the closing price – the GDX (NYSE:GDX) closed back below the May high (in terms of the daily closing price). That’s important, because that was the only breakout that we’ve seen in miners. They didn’t move above any long-term resistance and they didn’t even move above their declining resistance line that we marked in black on the above chart. With the only breakout being invalidated, the outlook is clearly bearish.
As far as the “Why is the time running out?” question is concerned, the reply is provided on the USD Index chart.
USD Index and Its Implications
In yesterday’s alert we wrote the following:
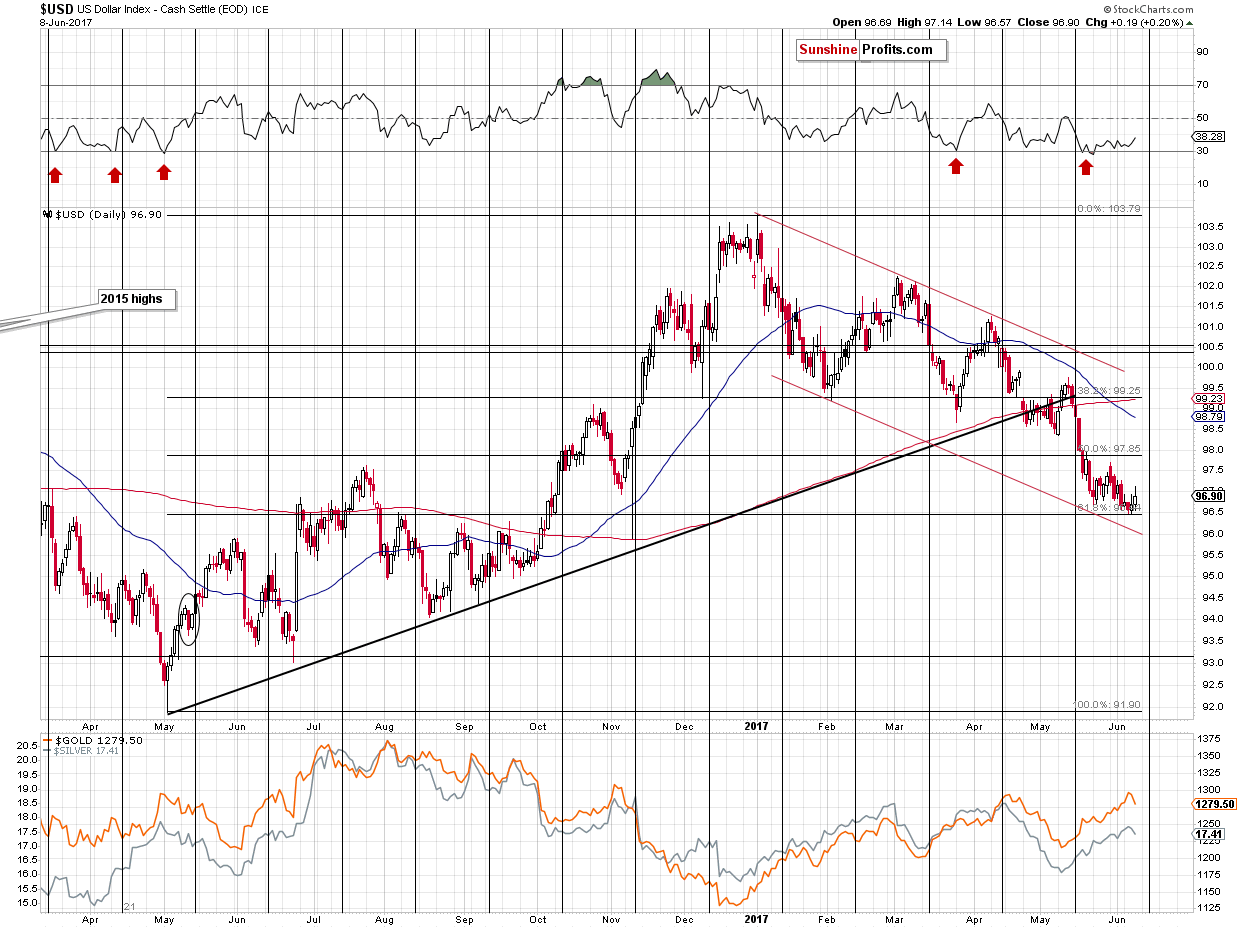
The cyclical turning point is just around the corner and since all recent major turnarounds took place right before the turning points, it’s likely that the turnaround will be seen shortly. Perhaps, the bottom is already in – the USD Index tested the Fibonacci retracement once again yesterday and there was no breakdown (let alone a confirmed one).
The RSI indicator remains close to the 30 level – the oversold territory, thus suggesting that the next short-term price move should be to the upside.
The USD Index finally moved a bit higher and even though this daily rally is nothing compared to the likely long-term upswing, it is a good start. The important thing is that metals and miners reacted to even a small sign of strength in the USD – this suggests that when the USD rallies further, metals and miners will further deteriorate instead of showing relative strength.
Summing up, even though this week’s price moves may have appeared significant, they actually changed very little. Important resistance levels were reached in gold and gold stocks and an important support was reached in the case of the USD Index. The proximity of the turning point in the USD Index suggests that the time is running out for the market to decide in which way the next move will take place. So, as far as predicting gold’s price is concerned, it seems that the market remains to be in the pennies to the upside and dollars to the downside territory (literally in the case of silver and the GDX) and thus the overall outlook remains bearish. Naturally, the above could change in the coming days.

