Gold and silver have been sliding down the charts and it’s about this time that people start to look for further upside potential as it touches new lows. I’m afraid to say though that further lows don’t look likely on the horizon at this point in time given the trend and the market movements of the USD.

Source: Blackwell Trader
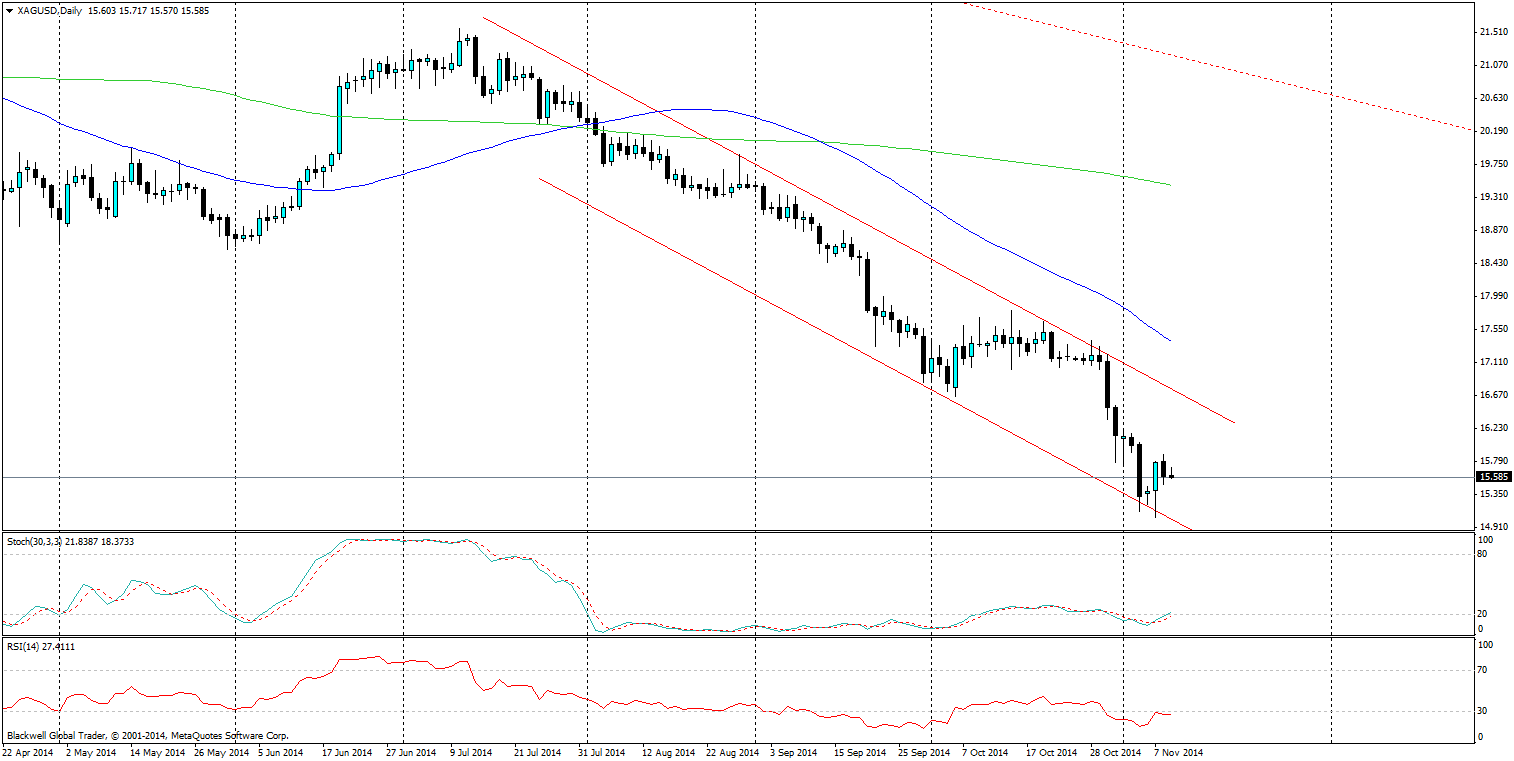
Silver has been trending down for some time on the market front and this channel looks unlikely to run away at any point as the labor market continues to pick up pace. In fact the trend is so strong that I would be worried for some market participants trying to go against it. Long term, it looks very bearish and I wouldn’t be surprised to still see some big movements lower; especially on the back of US data.
If there is a breakout higher and through the current channel, look for resistance to be on the 50 day moving average (MA), and it will likely be fierce if there is a push higher.

Source: Blackwell Trader
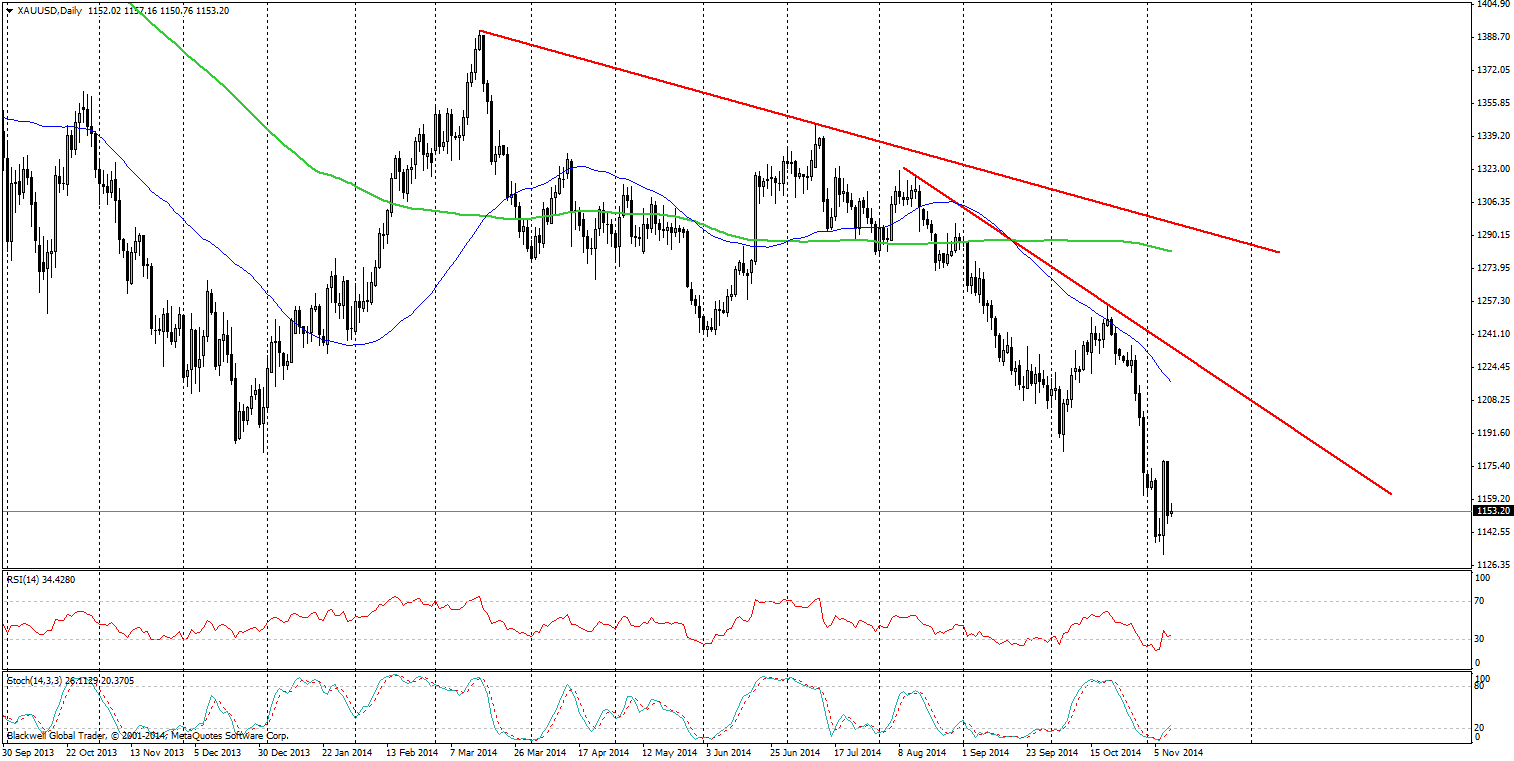
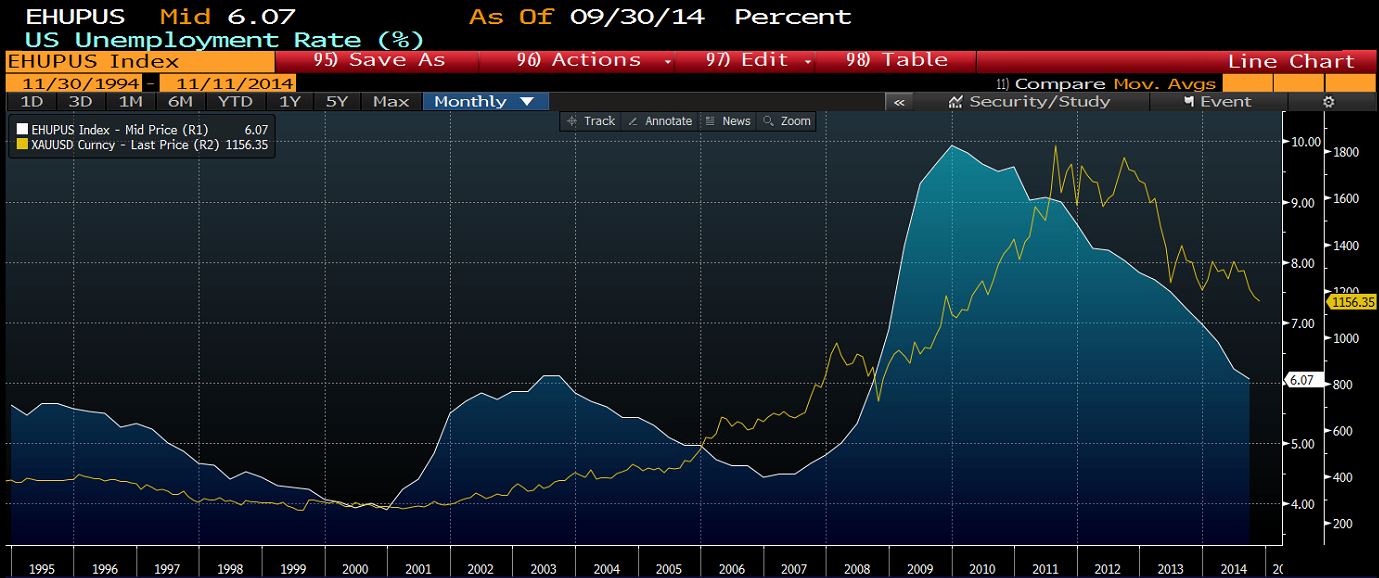
Gold has been trending down the charts just like silver, just the recent drops have been less technical when compared to silver. Also the market has been a little jittery around the 1200-1100 levels as it checks to see if this is a bottom. However, we have seen that the market believes there is further movement lower on the cards, and supporting this fundamentally is the recent gold to unemployment chart (see below), which shows that gold may still have further falls on the cards in the long run.
As for gold, if there is further support in the market we can expect the trend line above to show strong resistance against any further rises as well as the 50 day MA, which has shown strength when the market is searching upwards.

Source: Bloomberg
Overall, both gold and silver still have a lot of room left to move lower on the charts if US data is anything to go by. However, markets should look to target key levels at 1140 for gold and 15.00 for silver, which is currently acting as a psychological level. Movement below these levels would signal the bears rushing back into find further lows.
