The Fed’s Zero Interest Rate Policy is on thin ice
I am not an economist. I look at charts. When the charts send a clear signal I take it as an indication of what MIGHT happen. I deal with probabilities and possibilities, not predictions or certainties.
The charts are yelling from the hill tops about the Eurodollar market (the interest rate, not the currency unit).
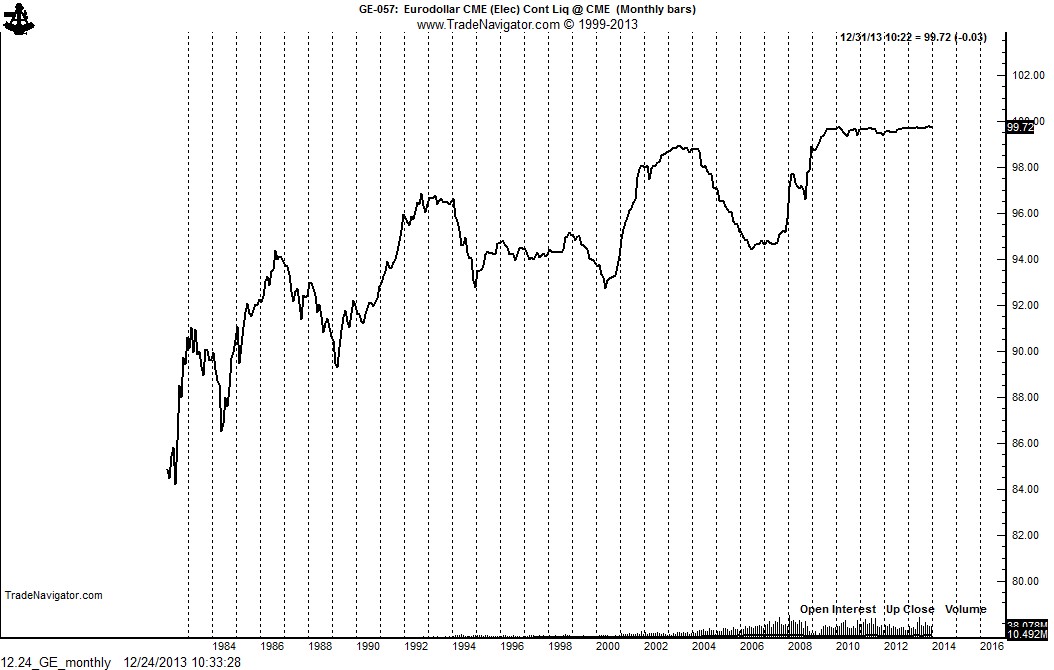
Let’s take a look at the chart structure for the Eurodollar market:
Eurodollars trade at the inverse to actual yield. A Eurodollar price of 100 means 0% yield, 98.00 means 2% yield, 92.00 means 8% yield. I believe we are in a trend that will take Eurodollar rates to 5% yield over the next few years.
The monthly graph shows that Eurodollar prices act like a yo-yo, alternating strong up-trends with strong down trends.
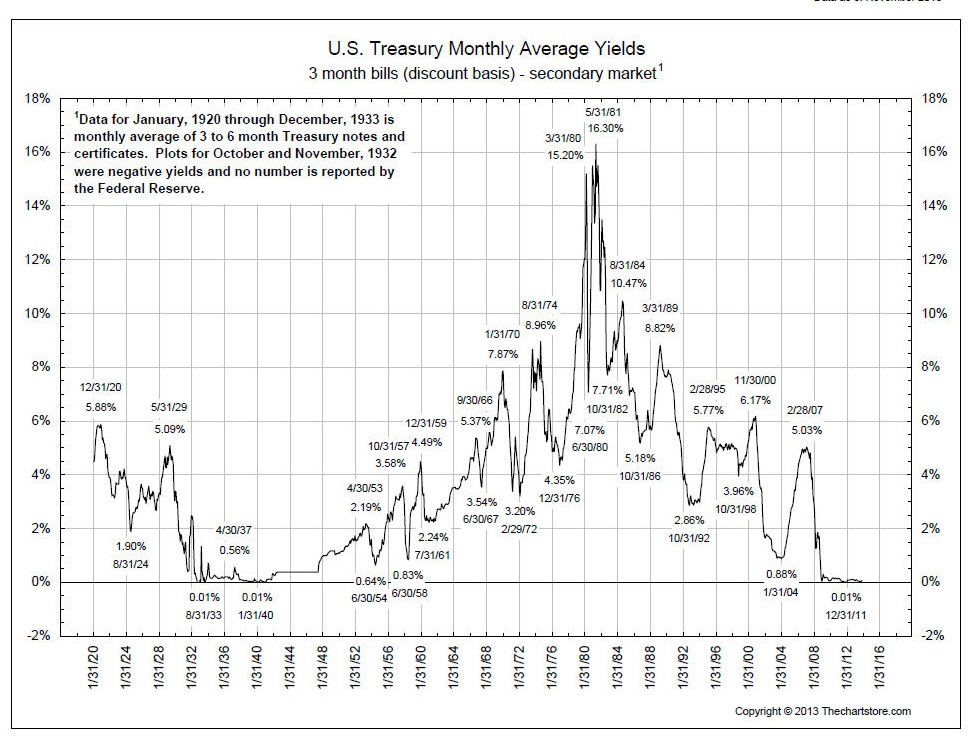
Not since the Great Depressoin have we had a Zero Interest Rate Policy (ZIRP) for this length of time. See the long-term chart of T-Bill yields below:.
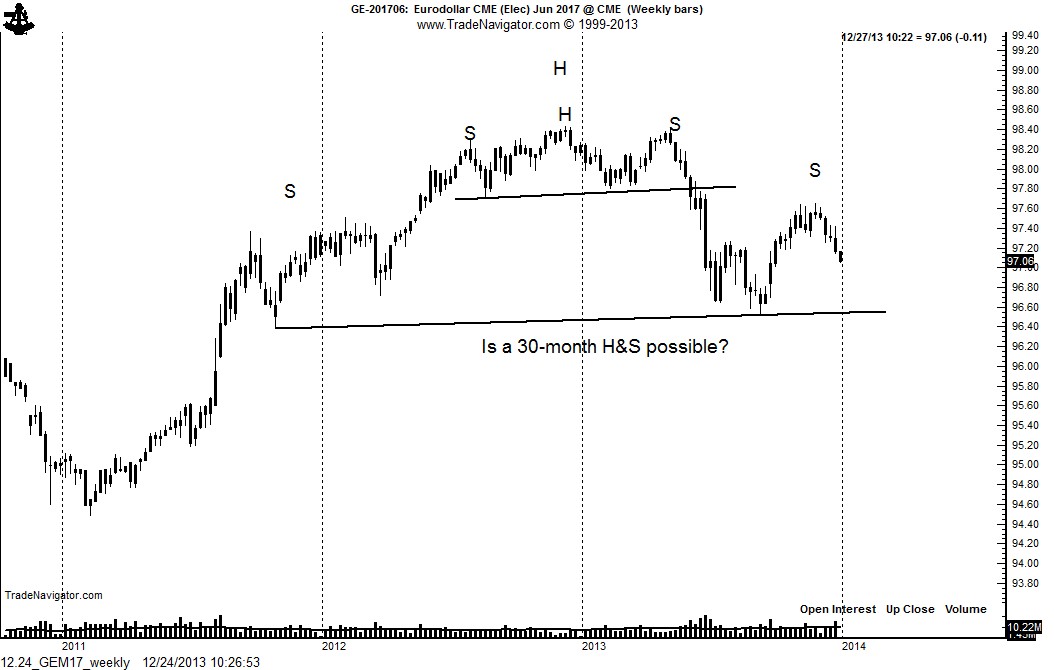
The weekly chart of the June 2017 contract completed a massive and powerful head-and-shoulders top in late May. The target of this pattern at 96.70 (3.3% yield) was quickly met. The rally from the September low to the October high was simply a counter-trend retest of the top. Importantly, the construction of the weekly chart now suggests the possibility of a H&S top dating back to August 2011. If valid, this pattern would have a target of 94.50 (5.5% yield).
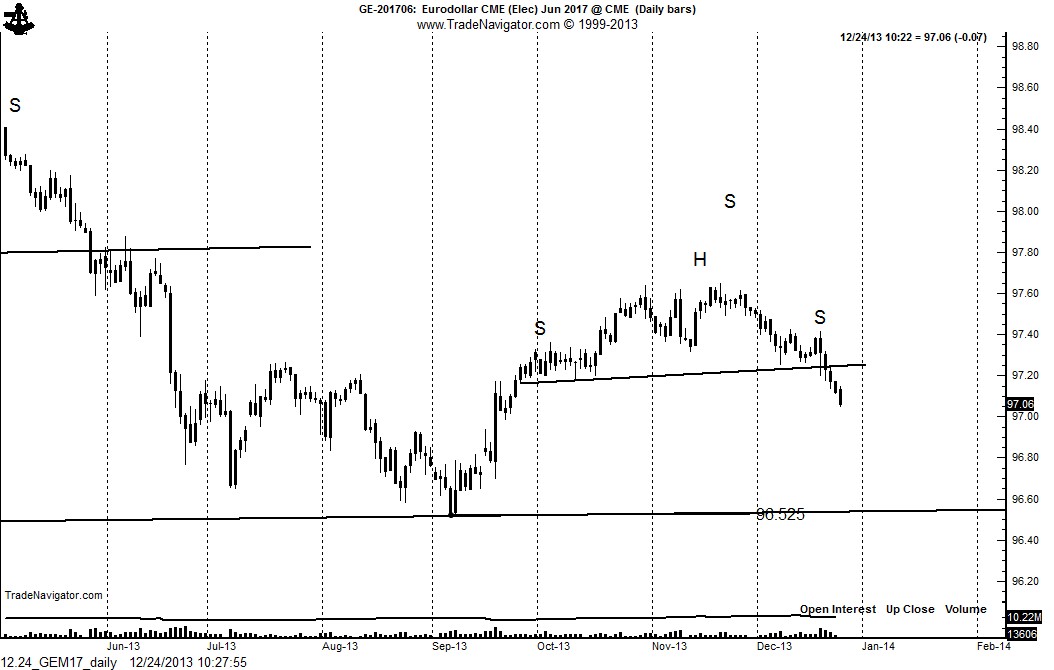
The daily chart displays another H&S top, completed on December 19. This pattern should lead to a retest of the September low at 96.50 (3.5% yield).
My conclusion from the charts — a possibility of a 5.5% Eurodollar yield by mid 2017.
Disclosure: The information in this blog post represents my own opinions and does not contain a recommendation for any particular security or investment. I or my affiliates may hold positions or other interests in securities mentioned in the Blog, please see my Disclaimer page for my full disclaimer.
- English (UK)
- English (India)
- English (Canada)
- English (Australia)
- English (South Africa)
- English (Philippines)
- English (Nigeria)
- Deutsch
- Español (España)
- Español (México)
- Français
- Italiano
- Nederlands
- Polski
- Português (Portugal)
- Português (Brasil)
- Русский
- Türkçe
- العربية
- Ελληνικά
- Svenska
- Suomi
- עברית
- 日本語
- 한국어
- 简体中文
- 繁體中文
- Bahasa Indonesia
- Bahasa Melayu
- ไทย
- Tiếng Việt
- हिंदी
Merry Christmas! Higher Interest Rates Ahead
Latest comments
Loading next article…
Install Our App
Risk Disclosure: Trading in financial instruments and/or cryptocurrencies involves high risks including the risk of losing some, or all, of your investment amount, and may not be suitable for all investors. Prices of cryptocurrencies are extremely volatile and may be affected by external factors such as financial, regulatory or political events. Trading on margin increases the financial risks.
Before deciding to trade in financial instrument or cryptocurrencies you should be fully informed of the risks and costs associated with trading the financial markets, carefully consider your investment objectives, level of experience, and risk appetite, and seek professional advice where needed.
Fusion Media would like to remind you that the data contained in this website is not necessarily real-time nor accurate. The data and prices on the website are not necessarily provided by any market or exchange, but may be provided by market makers, and so prices may not be accurate and may differ from the actual price at any given market, meaning prices are indicative and not appropriate for trading purposes. Fusion Media and any provider of the data contained in this website will not accept liability for any loss or damage as a result of your trading, or your reliance on the information contained within this website.
It is prohibited to use, store, reproduce, display, modify, transmit or distribute the data contained in this website without the explicit prior written permission of Fusion Media and/or the data provider. All intellectual property rights are reserved by the providers and/or the exchange providing the data contained in this website.
Fusion Media may be compensated by the advertisers that appear on the website, based on your interaction with the advertisements or advertisers.
© 2007-2025 - Fusion Media Limited. All Rights Reserved.
