After featuring AUD/JPY stepping down between support/resistance levels in Monday’s blog, I wanted to continue the yen theme with a similar setup on GBP/JPY.
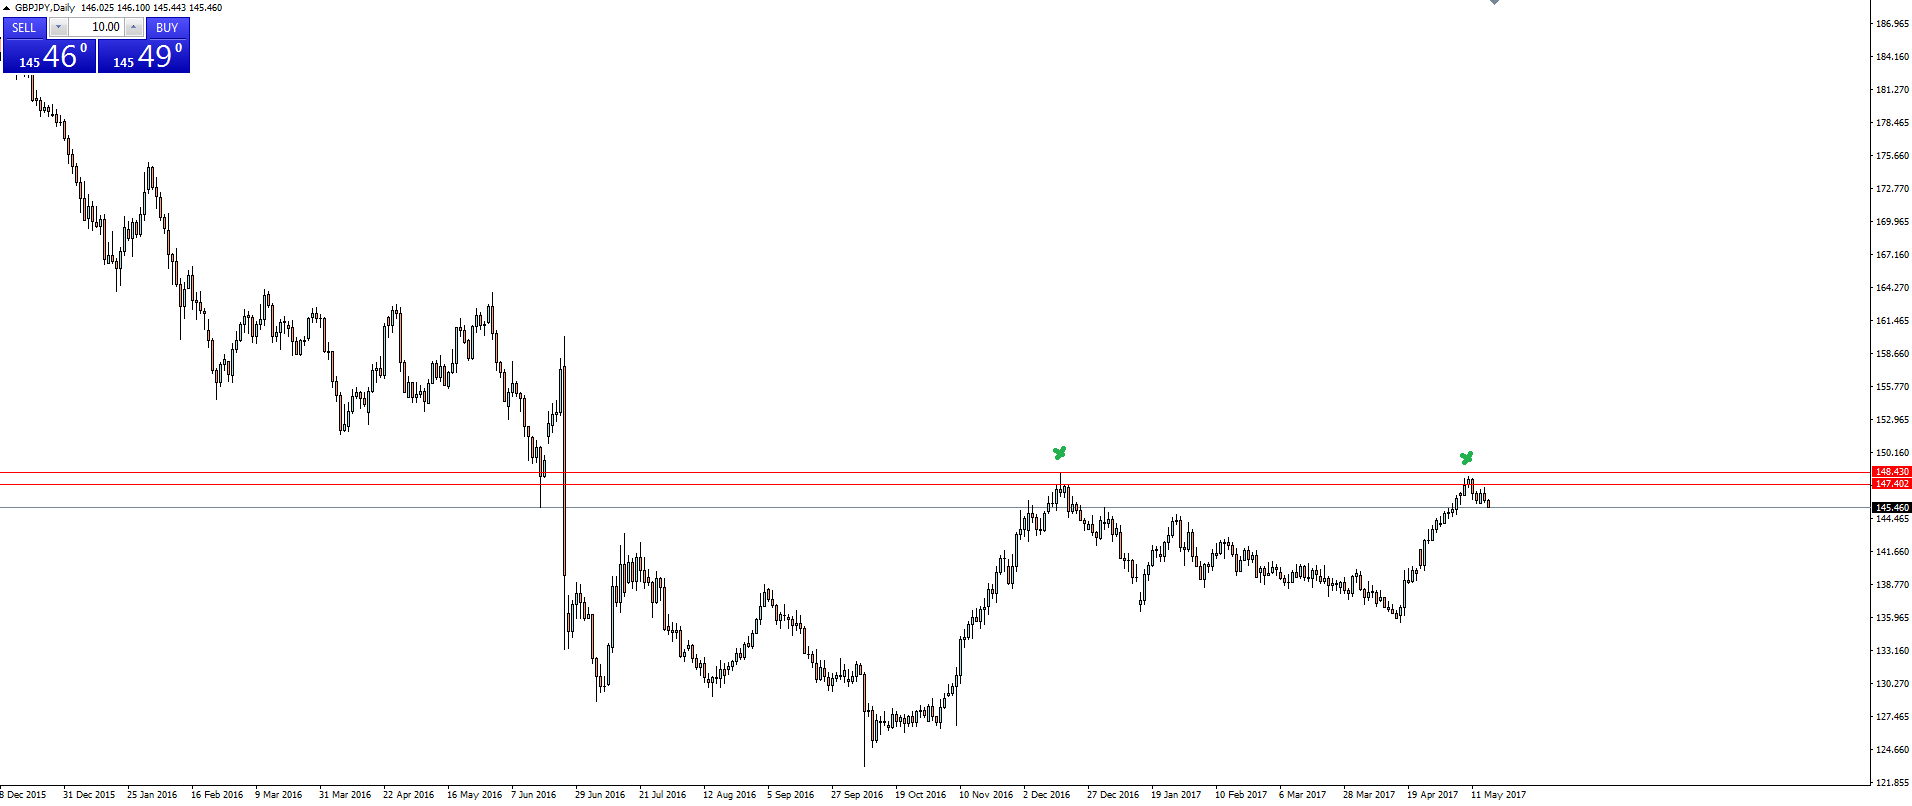
First up we have a higher time frame resistance zone on the daily chart which price re-tested and subsequently held:
You can seen just before the Brexit drop back in June 2016, that price also bounced off this zone as it looked like the vote would be a sure thing to the stay side. Just quietly, how good is hindsight.
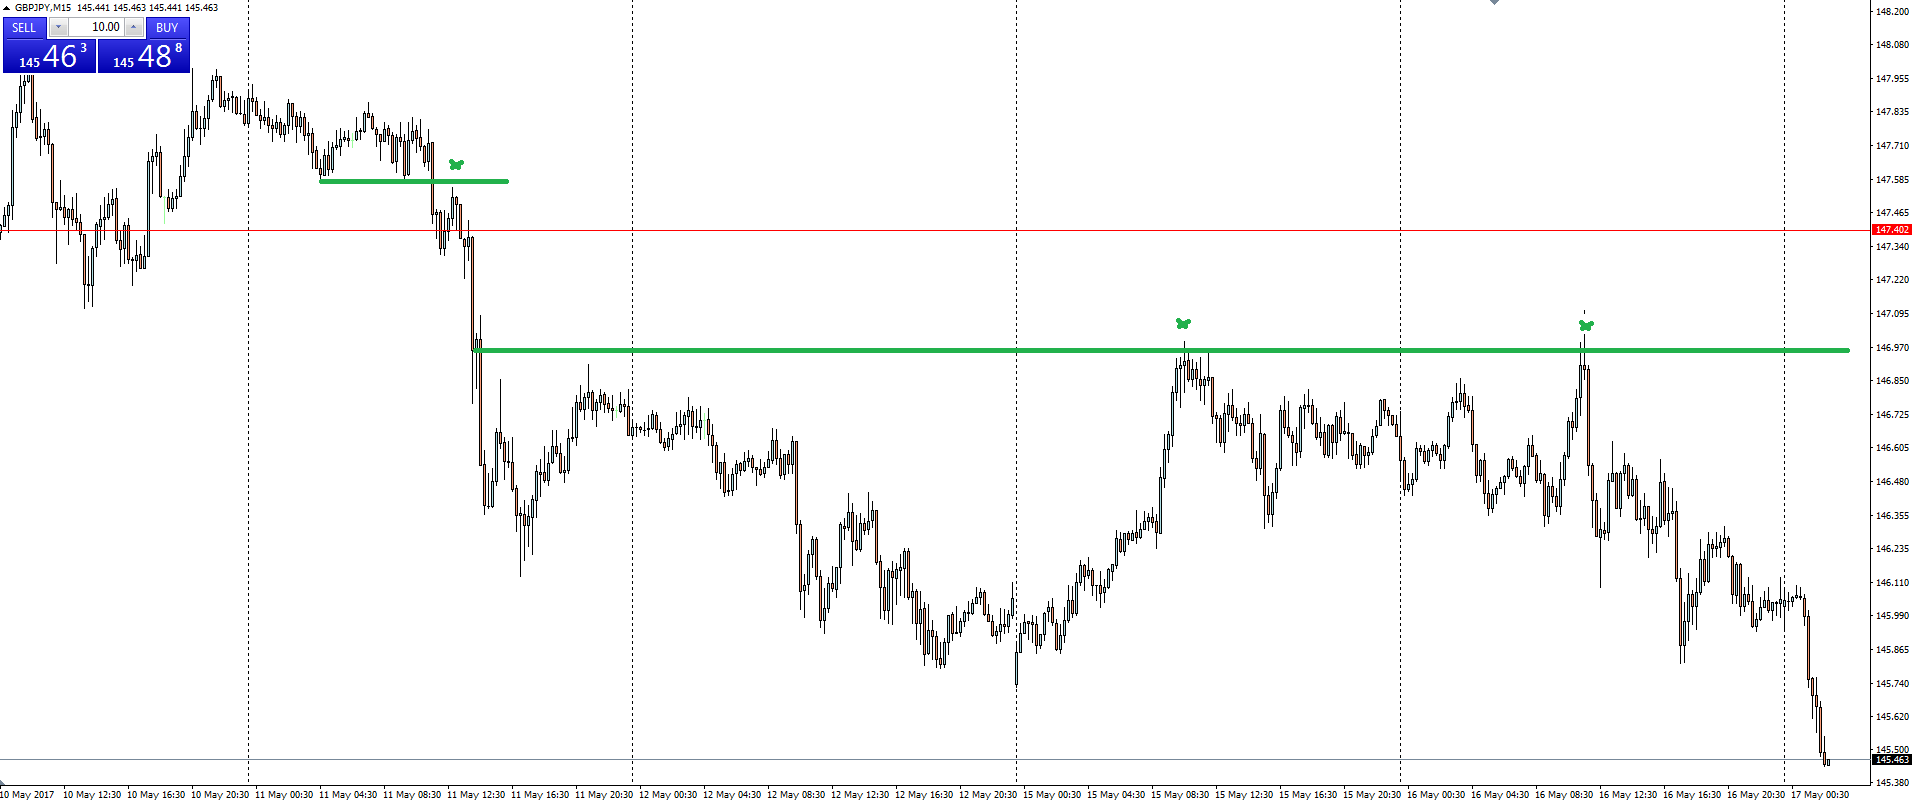
Secondly, we zoom into an intraday chart with the 15 minute featured here to show how price then stepped between short term levels off the higher time frame resistance level:
That is a textbook intraday bearish trending market where price breaks short term support, retests it as resistance, then continues downward repeating the pattern again and again.
How do you expect price to react now that the swing low has broken? Will the pattern continue?
Risk Disclosure: In addition to the website disclaimer below, the material on this page prepared by Vantage FX Pty Ltd does not contain a record of our prices or solicitation to trade. All opinions, news, research, tools, prices or other information is provided as general market commentary and marketing communication – not as investment advice. Consequently, any person acting on it does so entirely at their own risk. The expert writers express their personal opinions and will not assume any responsibility whatsoever for the Forex account of the reader. We always aim for maximum accuracy and timeliness, and forex broker Vantage FX shall not be liable for any loss or damage, consequential or otherwise, which may arise from the use or reliance on this service and its content, inaccurate information or typos. No representation is being made that any results discussed within the report will be achieved, and past performance is not indicative of future performance.


