Investing.com’s stocks of the week
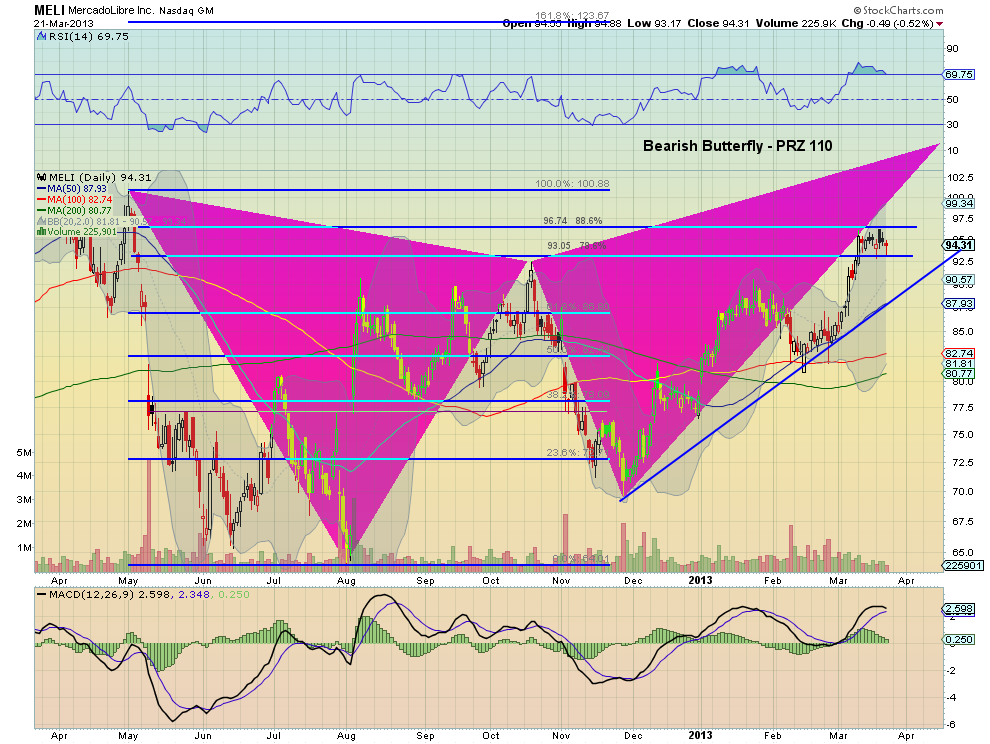
MercadoLibre (MELI) is eBay's Latin American partner, and a difficult stock to understand. Take look at the daily chart below. Lines and triangles everywhere. But two stories emerge if you zoom in: one bullish and the other bearish, a good set up for a trader.
The Bull Case
As we're in a bull market, we'll start with the bullish case. The stock has moved higher off of November lows in three steps and is consolidating, ready for the next move in a bull flag. That flag is between the 78.6% and 88.6% Fibonacci retracement levels at 93.05 and 96.74, suggesting a move over the top will complete the retracement to 100.88. This would also fit with the view that the round number would attract it. There is 18% short interest that could fuel a squeeze. The Relative Strength Index (RSI) is bullish, and has worked off the technically overbought condition so can support more upside. There is also a Harmonic Butterfly pattern playing out with a Potential Reversal Zone (PRZ) at 110.83 above.
The Bear Case
On the other side of the coin, it may lose support of that flag. In that case, the 50 day Simple Moving Average (SMA) below at the rising trendline support would coincide with support from the previous high area at 89.00-89.25. Below that, the 100 day SMA provided support on the last pullback. That RSI could continue lower along with the Moving Average Convergence Divergence (MACD) indicator, which is rolling over on the signal line and and heading to zero on the histogram. That short interest seems pretty determined as it has not let up at these levels.
The Trade
So what do you do? Play it long or play it short? The implied volatility is not very high at 35% in May, but looking at owning the May 95/97.5 Strangle (buying the May 95 Put and the May 97.5 Call) still seems expensive at $9.80, over 10% of the price. The April Strangle is a little better at only $5.20, but still needs to move a lot in 3 weeks to pay off.
The only answer that is left is to play it like a trader. Watch the consolidation flag. Set upside and downside alerts, and be ready to play it either way on the break.
The information in this blog post represents my own opinions and does not contain a recommendation for any particular security or investment. I or my affiliates may hold positions or other interests in securities mentioned in the Blog, please see my Disclaimer page for my full disclaimer.
Original post
