Even after the good gains shown for personal consumer income in January 2014, this factor continues to constrain economic expansion.
There was a relatively good report issued by the BEA (U.S. Dept. of Commerce Bureau of Economic Analysis) for January 2014 personal income and expenditures. Basically it showed a fairly strong improvement in personal income (the same increase in expenditures).
Seasonally & Inflation Adjusted Percent Change From the Previous Month – Personal Disposable Income (red line) and Personal Consumption Expenditures (blue line)
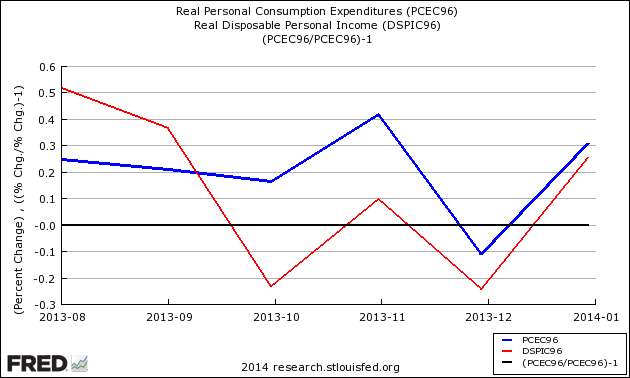
Also, the year-over-year growth improved for income, but that was caused by an income spike in the data for December 2012 and an off-setting drop the following month which is easy to see in the blue line in the graph below. You can understand how the December 2013 data would indicate a contraction year-over-year, and how January 2014 would show growth year-over-year because of this spike.
But stepping back from the micro view, and indexing the data to January 2000 – it is easy to see the constraint to the consumer spending more clearly. [Note:to demonstrate this index point was not cherry picked - click here to see a broader view of the graph below]
Indexed to Jan 2000, Growth of Real Disposable Income (blue line) to Real Expenditures (red line)
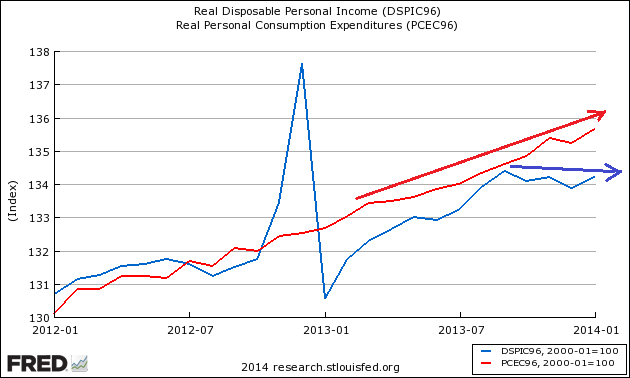
The gap continues to widen between personal income and personal expenditures. There is no apparent upward trend in income since September 2013, all while expenditures continued trending up. Keep in mind that this is aggregate growth, which we know is being heavily influenced by the 0.1%. A Sentier Research median household income graph shows that the relative income almost unchanged since January 2012 (red line on graph below).
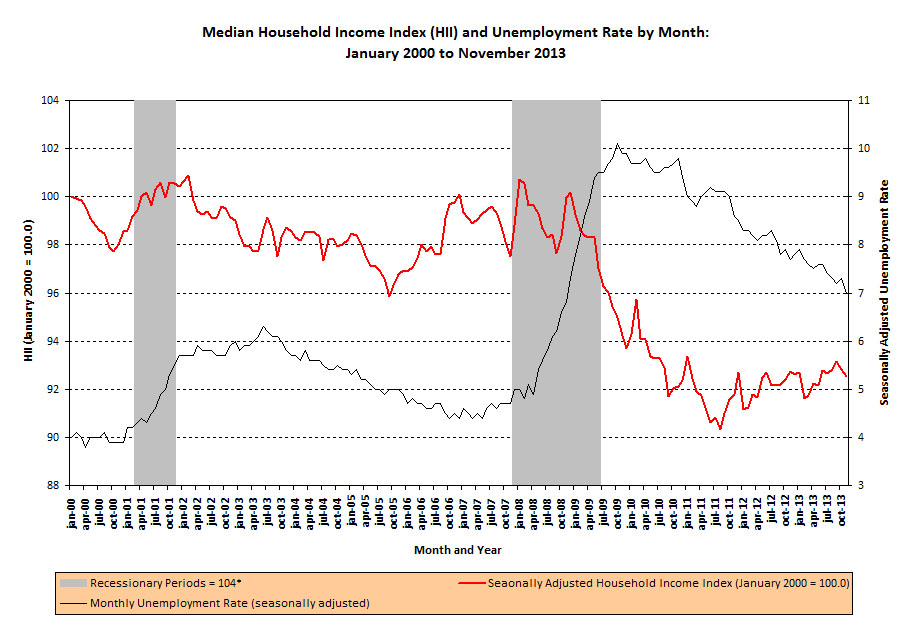
One should note that median incomes did not spike in December 2012 – so we know that little of this money made it into the pockets of the lower income. It would be interesting to see median expenditures. One possible conclusion is that upper income receipts were moved forward from January 2013 to December 2012 out of uncertainty over the income tax prospects for 2013. Without further data that is a speculation based on circumstantial evidence.
Because little is known about median spending, politicians and pundits can fill your mind with their opinion of what is going on. Some (many?) of them will not distinguish between proof, circumstantial evidence and speculation.
Other Economic News this Week:
The Econintersect Economic Indexfor March 2014is showing a moderate growth deceleration. There are soft data points we watch outside of our index which bears watching. Nothing at this time is pointing to real economic contraction, but there is enough data sets in the warning track to let you know that the economy is far from running on all cylinders.
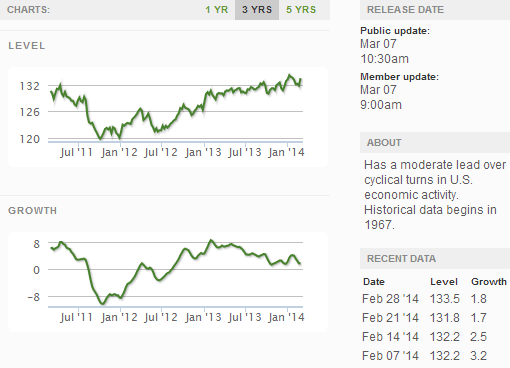
The ECRI WLI growth index value has been weakly in positive territory for over four months – but in a noticeable improvement trend. The index is indicating the economy six month from today will be slightly better than it is today.
Current ECRI WLI Growth Index
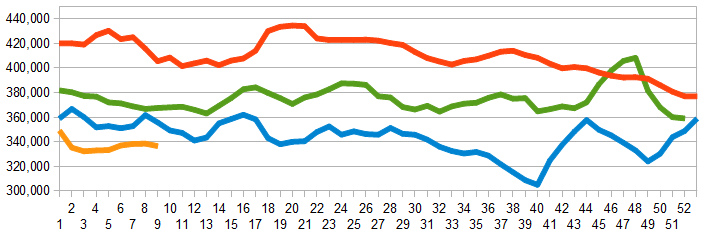
Initial unemployment claims went from 348,000 (reported last week) to 323,000 this week. Historically, claims exceeding 400,000 per week usually occur when employment gains are less than the workforce growth, resulting in an increasing unemployment rate. The real gauge – the 4 week moving average – marginally worsened from 338,500 (reported last week as 338,250) to 336,500. Because of the noise (week-to-week movements from abnormal events AND the backward revisions to previous weeks releases), the 4-week average remains the reliable gauge.
Weekly Initial Unemployment Claims – 4 Week Average – Seasonally Adjusted – 2011 (red line), 2012 (green line), 2013 (blue line), 2014 (orange line)
Bankruptcies this Week: Sorenson Communications, Privately-held MACH Gen, USEC
Weekly Economic Release Scorecard:
Click here to view the scorecard table below with active hyperlinks

