Medco Health Solutions, Inc. (Medco) is a healthcare company. Medco provides clinically-driven pharmacy services designed for private and public employers, health plans, labor unions and government agencies of all sizes, and for individuals served by Medicare Part D Prescription Drug Plans.
This is a takeover note with an interesting vol event approaching and equity market pricing. First, the news:
Announced on 07/21/2011
Medco Health Solutions Inc. (MHS) and Express Scripts Inc. (ESRX) announced a cash and stock merger. Each shareholder of Medco Health Solutions Inc. (MHS) will receive $71.36 per share in cash and stock.
Source: Livevol® Pro
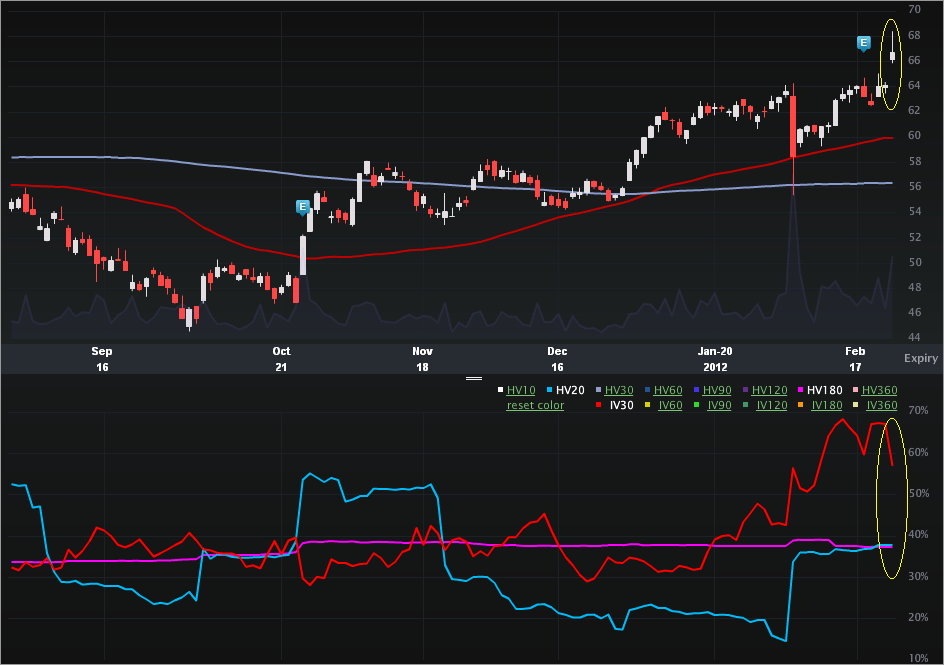
Note the takeover price and the proce today. That $66 price is a new high for MHS. The news that has closed that spread is included below:
Expectations for regulatory approval of Express Scripts’ planned $29 billion acquisition of fellow pharmacy-benefits manager Medco Health Solutions haven’t exactly been high, but appear to be picking up recently.
Today, Medco shares hit an all-time high on a late-Friday report from anti-trust research firm MLex that the deal would win approval.
Gabelli & Co.’s Jeff Jonas told Dow Jones today that Medco’s shares should be even higher given the report.
Express Scripts declined to comment on the report.
Source: Medco Hits New High As Express Scripts Deal Gains Confidence, written by David Benoit and Corrie Driebusch
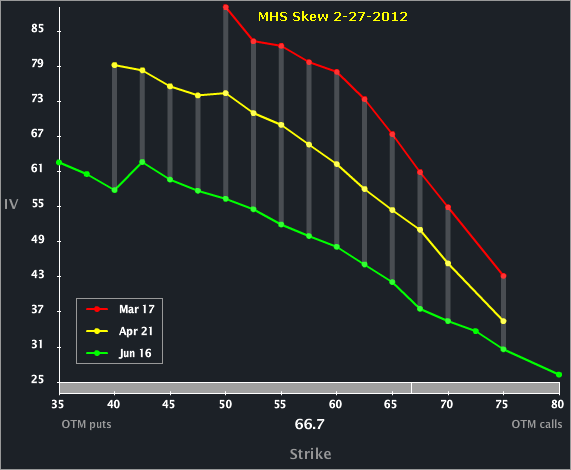
Let's start with the Skew Tab.

Two phenomena that are of particular interest:
1. The front is elevated to the back months -- there is a news event coming out (a ruling) that will determine if this takeover / merger actually happens. This was a $55 stock the day before the announcement, so the potential fallout is not trivial.
2. The upside skew bends down -- the option market reflects substantially less upside potential relative to downside risk. In English, if the deal doesn't go through, the option market does not reflect a high likelihood of another bid (higher bid) from a different source.
Let's turn to the Charts Tab (six months), below. The top portion is the stock price, the bottom is the vol (IV30™ - red vs HV20™ - blue vs HV180™ - pink).

Check out the vol portion. As Mar expo fades away and the day of the news event approaches, it's mathematically tautological that the vol will rise. That's what we saw up until today. The report (new news) though has apparently made the market "understand" that the likelihood of "bad" news has gone down. Hmm...
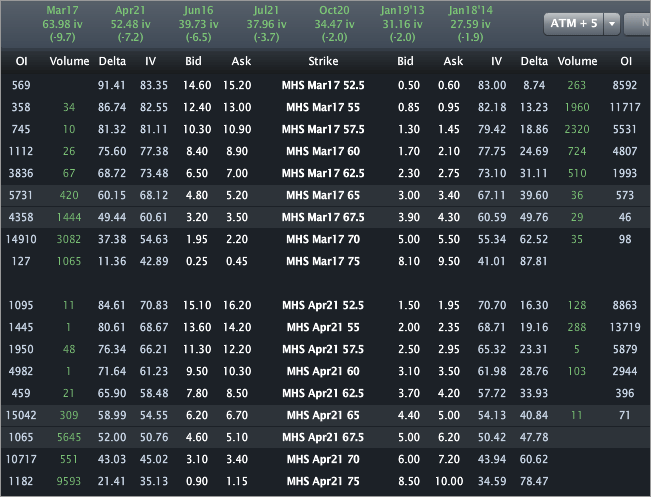
Finally, let's turn to the Options Tab, for completeness.

Looking across the top, we can see that the monthly vols are 63.98%, 52.48% and 39.73% for Mar, Apr and Jun, respectively. Digging a bit deeper, we can see that the front month vol has come down 9.7 vol points, while Apr is down 7.2 vol points. The current 11.5 vol point spread was two points higher as of Friday's close. That's more evidence that the risk inherent in the upcoming news has lessened rather suddenly.
This is trade analysis, not a recommendation.
This is a takeover note with an interesting vol event approaching and equity market pricing. First, the news:
Announced on 07/21/2011
Medco Health Solutions Inc. (MHS) and Express Scripts Inc. (ESRX) announced a cash and stock merger. Each shareholder of Medco Health Solutions Inc. (MHS) will receive $71.36 per share in cash and stock.
Source: Livevol® Pro
Note the takeover price and the proce today. That $66 price is a new high for MHS. The news that has closed that spread is included below:
Expectations for regulatory approval of Express Scripts’ planned $29 billion acquisition of fellow pharmacy-benefits manager Medco Health Solutions haven’t exactly been high, but appear to be picking up recently.
Today, Medco shares hit an all-time high on a late-Friday report from anti-trust research firm MLex that the deal would win approval.
Gabelli & Co.’s Jeff Jonas told Dow Jones today that Medco’s shares should be even higher given the report.
Express Scripts declined to comment on the report.
Source: Medco Hits New High As Express Scripts Deal Gains Confidence, written by David Benoit and Corrie Driebusch
Let's start with the Skew Tab.

Two phenomena that are of particular interest:
1. The front is elevated to the back months -- there is a news event coming out (a ruling) that will determine if this takeover / merger actually happens. This was a $55 stock the day before the announcement, so the potential fallout is not trivial.
2. The upside skew bends down -- the option market reflects substantially less upside potential relative to downside risk. In English, if the deal doesn't go through, the option market does not reflect a high likelihood of another bid (higher bid) from a different source.
Let's turn to the Charts Tab (six months), below. The top portion is the stock price, the bottom is the vol (IV30™ - red vs HV20™ - blue vs HV180™ - pink).

Check out the vol portion. As Mar expo fades away and the day of the news event approaches, it's mathematically tautological that the vol will rise. That's what we saw up until today. The report (new news) though has apparently made the market "understand" that the likelihood of "bad" news has gone down. Hmm...
Finally, let's turn to the Options Tab, for completeness.

Looking across the top, we can see that the monthly vols are 63.98%, 52.48% and 39.73% for Mar, Apr and Jun, respectively. Digging a bit deeper, we can see that the front month vol has come down 9.7 vol points, while Apr is down 7.2 vol points. The current 11.5 vol point spread was two points higher as of Friday's close. That's more evidence that the risk inherent in the upcoming news has lessened rather suddenly.
This is trade analysis, not a recommendation.
