Performance monitoring comes in many flavors, including popular favorites such as drawdown and rolling return over some trailing window. A less-familiar but useful metric: streaks, which quantifies an uninterrupted run of performance, up or down.
Streaks can be thought of as a corollary measure to drawdowns (peak-to-trough declines). Although a version of downside data is included in streaks, these numbers also include upside changes and so in that sense there’s a fuller profile of performance trends beyond losses.
The only parameter for streaks is the trigger percentage change. For example, a 10% trigger would calculate all the positive (negative) return periods that didn’t include a countermove of -10% (+10%).
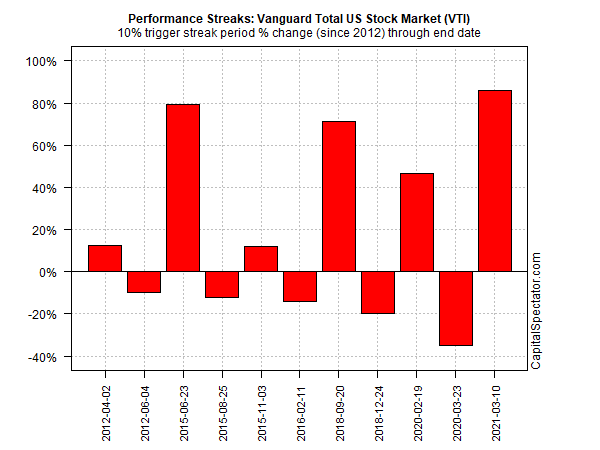
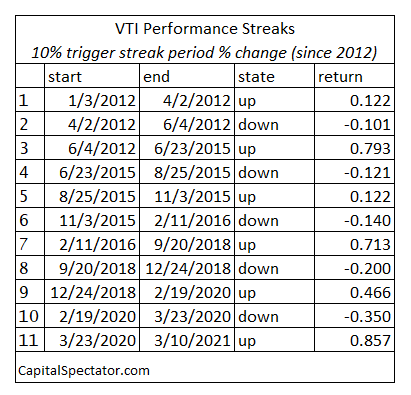
As an example, the chart below summarizes the performance streaks for the US stock market since 2012, based on the Vanguard Total Stock Market Index Fund (NYSE:VTI) through yesterday’s close (Mar. 10). During this period there were six positive streaks, with the latest (and ongoing) streak showing the biggest gain – more than 80%. On the flip side: there were five negative streaks. The biggest decline approached -40% and ended on Mar. 23, 2020, the bottom of the coronavirus crash.

Here’s how the raw data stacks up:

There are several facets to study in streaks. One is the raw percentage change, as shown above. Another approach is to review how long the streaks last and the interim volatility. This information can be useful for comparing assets for additional perspective on managing expectations in the design phase of asset allocation.
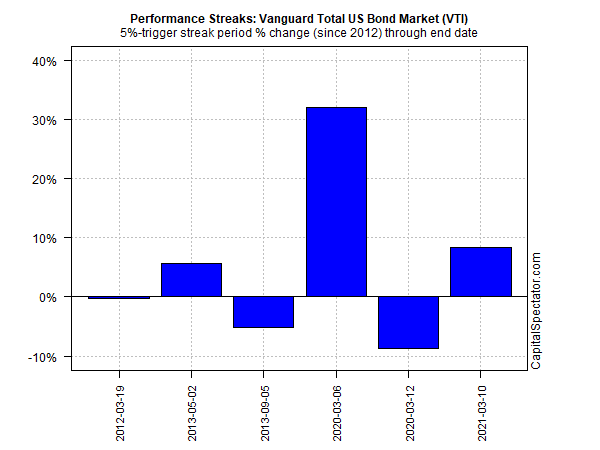
Not surprisingly, streak profiles can vary substantially by asset class and by changing the trigger point. For comparison with the VTI data, consider the US bond market’s streak data, based on Vanguard Total Bond Market Index Fund ETF Shares (NASDAQ:BND). Because BND’s is substantially less volatile than VTI, a lower trigger point is required. In this example, I cut the trigger in half to 5%.

In isolation, streaks data has limited value. But in context with the standard risk/return toolkit it adds another dimension in the delicate art/science of managing expectations.
