NVDA Q3 Earnings Alert: Why our AI stock picker is still holding Nvidia stockRead More

Measuring Oil’s Capitulation

Published 04/08/2015, 07:38 AM
Updated 05/14/2017, 06:45 AM
CL
-
USO
-

Crude Oil has had a really rough 7 months. The plunge in prices that began in October seems to have settled in for the last 2 months. And perhaps the price is ready to reverse higher. I am not the guy that needs to be able to say I got the absolute bottom so I will continue to wait for proof of not only a bottom, but that the consolidation is over and it wants to head higher.

At times like these it is important to remember that a stock or commodity or index or currency can have 3 different trends, not two. There is an uptrend and a downtrend, but there is also consolidation. The sideways trend. There is no reason that Oil or anything else needs to move from a downtrend directly to an uptrend. It could move sideways for years. In fact it has done this.
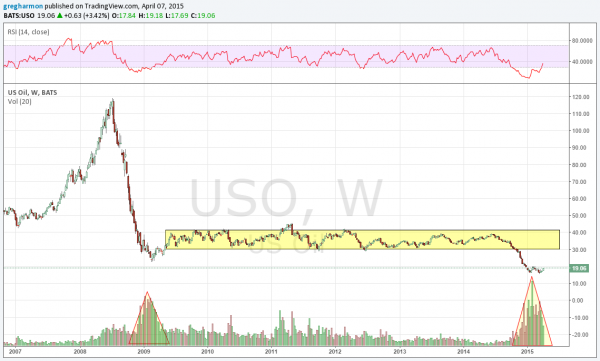
USO Weekly Chart

One proxy for Crude oil is the United States Oil Fund (NYSE:USO), who’s price chart is pictured above. There are two characteristics I want to focus on in that chart. The first supports the thesis above. The US Oil ETF fell hard with Oil prices in 2008 into early 2009. But from there is moved sideways for over 5 years. You need proof that a bounce does not always follow a fall then here it is.

The second characteristic is the two oversized triangles of volume that appear. The first occurred after the 2008 fall and the second is finishing out now, after the fall from last October. These triangular patterns signify capitulation. Volume building to a peak and then falling off. This is a real sign that the drop in Oil prices may be over. Now you know why I started with the first point. The drop may be over, but look for proof that the new direction is not sideways before getting involved.

Disclaimer: The information in this blog post represents my own opinions and does not contain a recommendation for any particular security or investment. I or my affiliates may hold positions or other interests in securities mentioned in the Blog, please see my Disclaimer page for my full disclaimer.

Original post

Latest comments

Loading next article…
Risk Disclosure: Trading in financial instruments and/or cryptocurrencies involves high risks including the risk of losing some, or all, of your investment amount, and may not be suitable for all investors. Prices of cryptocurrencies are extremely volatile and may be affected by external factors such as financial, regulatory or political events. Trading on margin increases the financial risks.
Before deciding to trade in financial instrument or cryptocurrencies you should be fully informed of the risks and costs associated with trading the financial markets, carefully consider your investment objectives, level of experience, and risk appetite, and seek professional advice where needed.
Fusion Media would like to remind you that the data contained in this website is not necessarily real-time nor accurate. The data and prices on the website are not necessarily provided by any market or exchange, but may be provided by market makers, and so prices may not be accurate and may differ from the actual price at any given market, meaning prices are indicative and not appropriate for trading purposes. Fusion Media and any provider of the data contained in this website will not accept liability for any loss or damage as a result of your trading, or your reliance on the information contained within this website.
It is prohibited to use, store, reproduce, display, modify, transmit or distribute the data contained in this website without the explicit prior written permission of Fusion Media and/or the data provider. All intellectual property rights are reserved by the providers and/or the exchange providing the data contained in this website.
Fusion Media may be compensated by the advertisers that appear on the website, based on your interaction with the advertisements or advertisers.
© 2007-2024 - Fusion Media Limited. All Rights Reserved.