Recently Fed Chair Janet Yellen and a study at the Federal Reserve of Atlanta have put a focus on the Bureau of Labor Statistics (BLS) participation rate as a good measure of employment slack. Slack means that there are more people willing and capable of filling a job than there are jobs for them to fill.
Follow up:
If one reads the definition of participation rate, it should be an excellent metric of employment slack.
Labor force (Current Population Survey): The labor force includes all persons classified as employed or unemployed in accordance with the definitions contained in this glossary.
Labor force participation rate: The labor force as a percent of the civilian noninstitutional population.
Simple - right? You figure out who is in the labor force by determining who is employed and unemployed (which would exclude anyone who was not looking for a job), then divide this work force number by the population. The details devil is in the historical look at what really happens.
Historically the participation rate is miraculously hardly ever affected the way that employment is by a recession. How do I know? Look at the chart below comparing participation rates to employment population ratios.
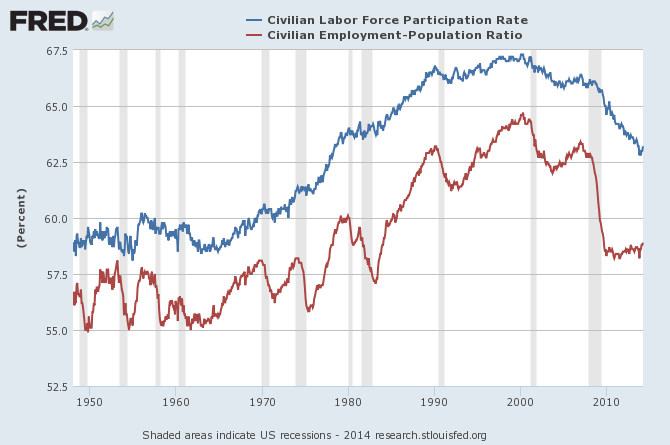
The employment population ratio is the proportion of the civilian noninstitutional population aged 16 years and over that is employed. No great data gathering exercise is necessary - simply divide the employed by the population. There is very little room to spin or manipulate this data - it is what it is.
The graph below shows the percent spread between the participation rate and the employment population ratio. It spikes at every recession. Could it be that the participation rate methodology is underestimating the size of the labor force?
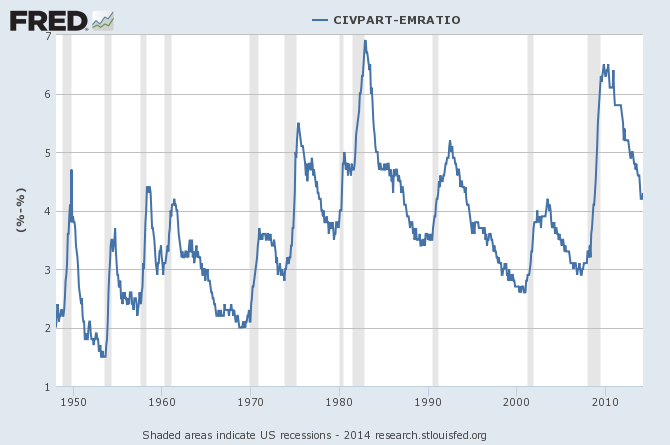
To an economist, measuring employment slack is the primary reason for watching employment / unemployment data. If there is too little employment slack, the economy is overheating - too much slack, the economy is struggling. Watching the participation rates historically would indicate that employment recessions do not exist. This is illogical and prima facia evidence participation rates are NOT accurately measuring slack.
I am not a genius for figuring this out. A 1981 Fed Reserve study concludes:
..... the ratio of employment-to-population also provides an excellent measure of economic performance . Because it relates the employment level to population size, the ratio is less strongly dominated by the economy's long-term growth trend than is the simple count of jobholders . The employment- population ratio often is statistically more reliable than the unemployment rate-employment being a more clear-cut condition than unemployment - and is subject to fewer sampling errors and seasonal adjustment problems. And, compared with labor force participation rates, the ratio has a more easily observable cyclical pattern with generally less month-to-month fluctuation.
Although the employment-population ratio does not have quite the same consistency in terms of cyclical timing as the jobless rate, it does move in a fairly predictable manner over the course of a business cycle and can be used to measure the effect of an economic downturn on longer-term employment trends . The ratio is also a useful tool for identifying substantial labor force variations, including those among demographic groups and among various States or regions of the Nation .
And what the current employment population ratio is telling us is that employment has stabilized for the last several years - but is having difficulty recovering to its previous levels.
But men are doing better than women in recovering from the Great Recession.
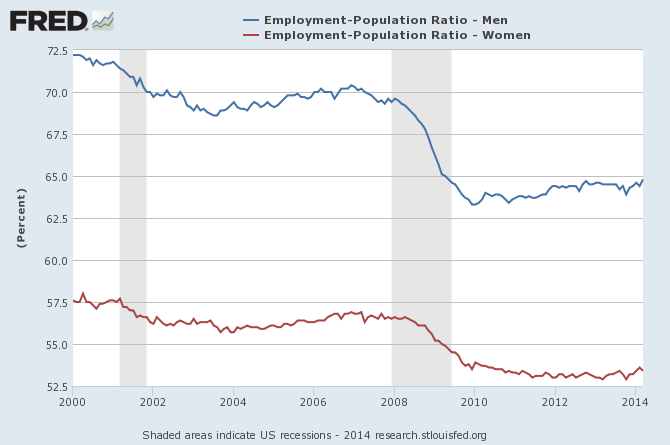
Some may blame it on demographics (i.e. population is aging) - but the employment population ratios tell us the older you are - the less effect the Great Recession had on your ability to find employment or keeping your existing job (green and purple lines below).
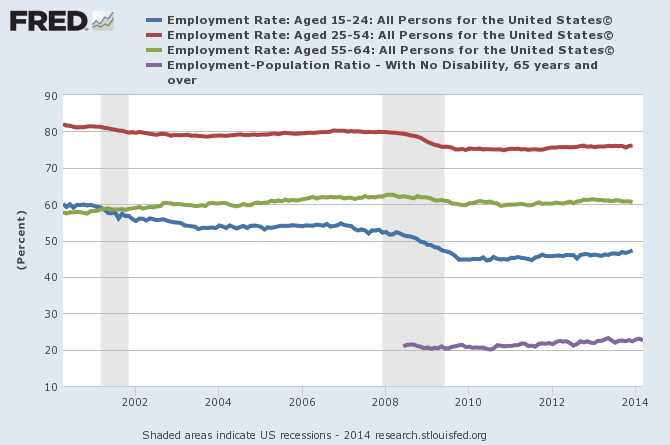
The real problem is not how the BLS delivers data to us as they are only the messenger - the problem is that employment is a lagging indicator - and has been in a declining trend during the entire 21st century. For 14 years, politicians and economists have been blaming the employment trends on a variety of causes (and none of them happen to be the BLS employment reports) - some cyclical, some transient, some structural.
I do not understand why people must wait around for somebody to create a job for them. In most countries, if you cannot find a job - you start your own business to feed yourself and your family. It seems to me that the current laws and regulations work against self employment. The government at all levels has made it pretty difficult for anyone to start their own business.
Other Economic News this Week:
The Econintersect Economic Index for April 2014 is again showing an extremely slight growth deceleration - but a growing economy nonetheless. There are a growing number of soft data points we watch outside of our index which bears watching. The economy remains too strong to recess, and too weak to grow.
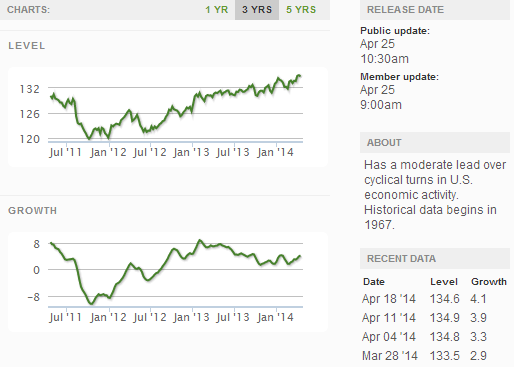
The ECRI WLI growth index value has been weakly in positive territory for many months - but now in a noticeable improvement trend. The index is indicating the economy six month from today will be slightly better than it is today.
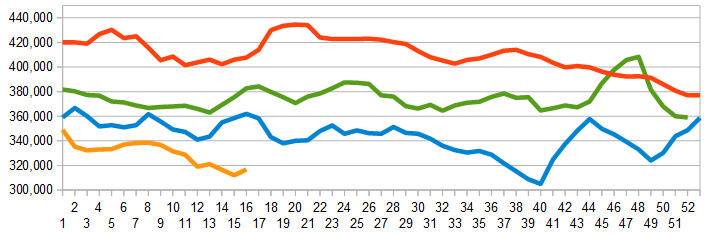
Initial unemployment claims went from 304,000 (reported last week) to 329,000 this week. Historically, claims exceeding 400,000 per week usually occur when employment gains are less than the workforce growth, resulting in an increasing unemployment rate. The real gauge – the 4 week moving average – marginally improved from 312,000 (reported last week as 312,000) to 316,750. Because of the noise (week-to-week movements from abnormal events AND the backward revisions to previous weeks releases), the 4-week average remains the reliable gauge.
Weekly Initial Unemployment Claims - 4 Week Average - Seasonally Adjusted - 2011 (red line), 2012 (green line), 2013 (blue line), 2014 (orange line)
Bankruptcies this Week: Genco Shipping & Trading (MPM), Furniture Brands International
Weekly Economic Release Scorecard:
Click here to view the scorecard table below with active hyperlinks
