Investing.com’s stocks of the week
Q: I have followed your analysis of the 30 year with great interest and have been able to capture some of this move – thank you for the education.
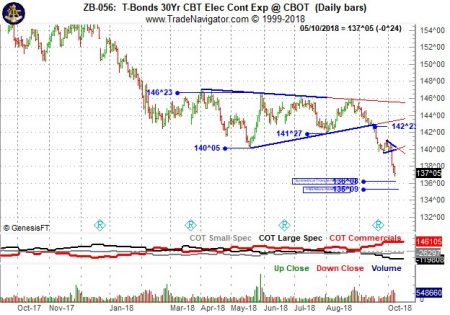
My question relates to the approximate measurement distance from the chart pattern. I have attached my chart of the 30yr continuation on a daily timescale.
I understand you have viewed this recent as a head and shoulders failure with the minimum measurement measured from the right shoulder (141-27), which equates to approximately 135-09 (thereabouts).
Could this not also be viewed as a Symmetrical Triangle whereby the minimum approximate target would be measure from the breakdown point (142-23), which equates to approximately 136-08?
I understand either of these are a guess and a guide, and at the current market price the more important factor would be the 3DTSR which would be in effect, if I have listened correctly.
Nonetheless, getting this price approximation target correct does affect the timing of the application of the 3DTSR.
Could you please give me your thoughts on these two possible measurement objectives? And ofcourse, point me in the right direction if some of my understanding is inconsistent with classical charting.
P.S. I understand these measurements are a small fraction of the larger bigger picture move that is possible.

A: Keep in mind that I eyeball targets and never calculate them with any accuracy unless prices start to get close.
The problem with your graph is that you start the symmetrical triangle with a high — under classical rules continuation triangle always originate from a low. I may take a target from any point within the triangle, often depending upon my mood or other considerations.
