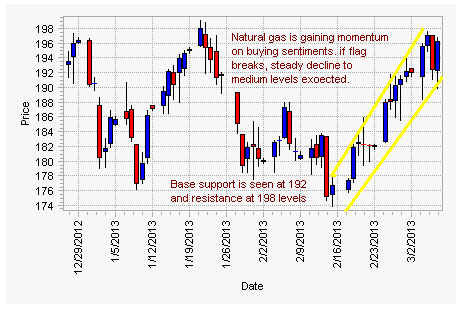
Natural Gas at MCX is trading at higher levels. Extreme crowd sentiments at global markets have impacted natural gas prices. Commodity is now trading around 192-196 levels.
The bullish flag pattern continues for the week as it has shown great momentum in the rally. If price breaks 198 levels, decline to 190 levels is expected. MCX Natural Gas is trading well above the 20-day SMA at 186 levels.
On MCX charts, natural gas is witnessing bullish trend. Prices are floating at higher levels of Bollinger band and stochastic levels have retreated from overbought territory.
MACD is positive and RSI at 63.66 is bullish. Rate of change oscillator (P-ROC) is sustaining its position at positive territory and positive momentum is a bullish factor for natural gas.
Base support is at 192 levels. If it breaks the levels, steady decline to 186 is expected. Resistance is seen at 198, 199 for long term.
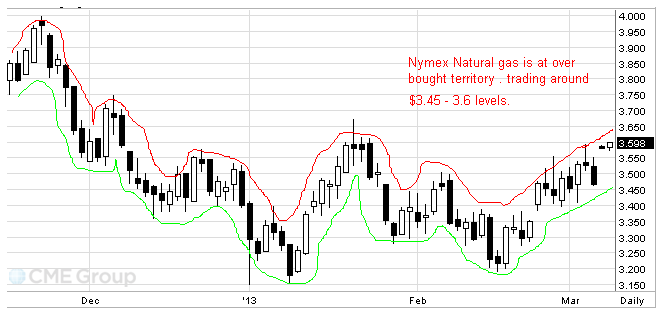
On Nymex charts, natural gas tracks at overbought territory and is trading around 3.45-3.6 levels. Flag value is not yet broken at Nymex markets. If it breaks the flag range, steady decrement to 3.35 levels is expected.
For MCX Natural Gas
- S1: 192 S2: 190
- R1: 198 R2: 199
