Last month, Comex Gold prices crashed by more than$200 an ounce - the steepest plunge in over 30 years. Along with Comex Gold, MCX Gold prices recorded the biggest ever fall of Rs 1250 per ten gram, hitting a one year low of 25200 in April 2013.
After a sharp fall in overseas and domestic markets, prices have shown a smart up move, testing the crucial resistance levels. On this bounce back, many investors has started to accumulate Gold and positional traders have built long positions. A strong break out from the triangle pattern, failure of crucial levels to provide any meaningful support and Elliott wave theory suggest the end of multiyear up trend and start of down move in yellow metal.
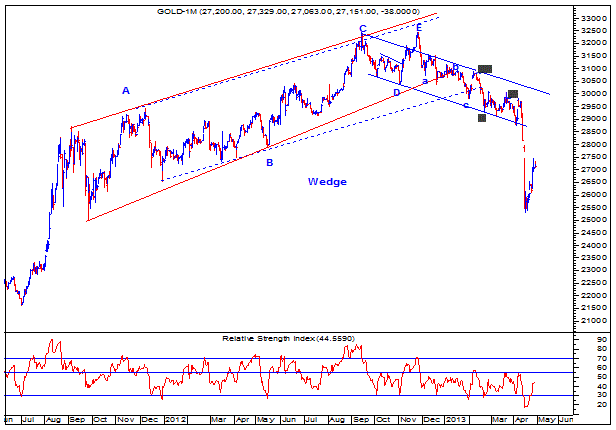
MCX Gold Continuous Daily chart:
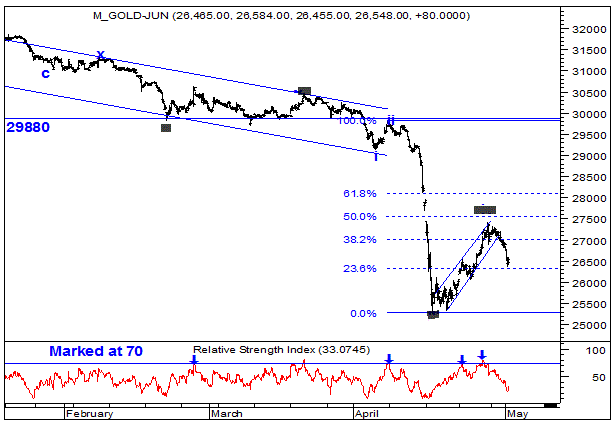
MCX Gold 60 mins chart:
Wave Analysis: Above is the daily chart of MCX Gold. Prices have breached the wedge pattern break out, and moved lower sharply. This is in sync with Comex Gold, indicating the bearish trend over medium term.
We can observe the above in the MCX Gold 60 mins chart: prices reversed exactly from 50% retracement of the prior wave iii, breaching the small upward sloping blue channel on downside and cloing near day’s low of 26365.
- English (UK)
- English (India)
- English (Canada)
- English (Australia)
- English (South Africa)
- English (Philippines)
- English (Nigeria)
- Deutsch
- Español (España)
- Español (México)
- Français
- Italiano
- Nederlands
- Português (Portugal)
- Polski
- Português (Brasil)
- Русский
- Türkçe
- العربية
- Ελληνικά
- Svenska
- Suomi
- עברית
- 日本語
- 한국어
- 简体中文
- 繁體中文
- Bahasa Indonesia
- Bahasa Melayu
- ไทย
- Tiếng Việt
- हिंदी
MCX Gold: Downtrend Resuming?
Published 05/02/2013, 08:18 AM
Updated 05/14/2017, 06:45 AM
MCX Gold: Downtrend Resuming?
Latest comments
Loading next article…
Install Our App
Risk Disclosure: Trading in financial instruments and/or cryptocurrencies involves high risks including the risk of losing some, or all, of your investment amount, and may not be suitable for all investors. Prices of cryptocurrencies are extremely volatile and may be affected by external factors such as financial, regulatory or political events. Trading on margin increases the financial risks.
Before deciding to trade in financial instrument or cryptocurrencies you should be fully informed of the risks and costs associated with trading the financial markets, carefully consider your investment objectives, level of experience, and risk appetite, and seek professional advice where needed.
Fusion Media would like to remind you that the data contained in this website is not necessarily real-time nor accurate. The data and prices on the website are not necessarily provided by any market or exchange, but may be provided by market makers, and so prices may not be accurate and may differ from the actual price at any given market, meaning prices are indicative and not appropriate for trading purposes. Fusion Media and any provider of the data contained in this website will not accept liability for any loss or damage as a result of your trading, or your reliance on the information contained within this website.
It is prohibited to use, store, reproduce, display, modify, transmit or distribute the data contained in this website without the explicit prior written permission of Fusion Media and/or the data provider. All intellectual property rights are reserved by the providers and/or the exchange providing the data contained in this website.
Fusion Media may be compensated by the advertisers that appear on the website, based on your interaction with the advertisements or advertisers.
© 2007-2025 - Fusion Media Limited. All Rights Reserved.
