MCX Crude OIl To Trade Sideways, Go Long: Angel Commodities

Published 10/28/2013, 05:43 AM
Crude Oil
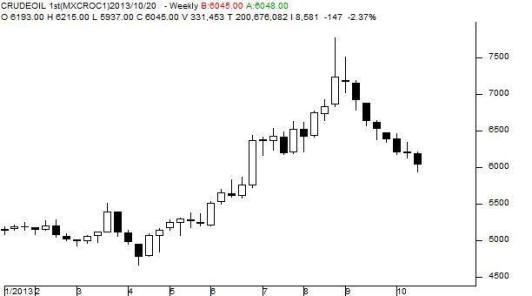
MCX Crude November as seen in the weekly chart above has opened the week at 6253 levels initially moved marginally higher and as expected found very good resistance at 6262 levels. Later prices fell sharply breaking both the supports towards 5937 levels, but could not sustain bounced back higher towards 6053 levels and finally closed lower from the previous week closing levels.

For the next week we expect Crude prices to find support in the range of 5970 –5950 levels. Trading consistently below 5930 levels would lead towards the strong support at 5840 levels and then finally towards the major support at 5755 levels. Resistance is now observed in the range of 6135-6145 levels. Trading consistently above 6160 levels would lead towards the strong resistance at 6254 levels, and then finally towards the Major resistance at 6365 levels.

MCX / NYMEX Crude Oil Trading levels for the week

Trend: Sideways
S1- 5965/ $ 96.50 R1-6142 / $ 99.40
S2-5840 / $ 94.50 R2-6254 / $ 101.20

Weekly Recommendation (28 October to November 1): Buy MCX Crude November between 6015-5995, SL-5940, Target -6130.

Latest comments

Loading next article…
Risk Disclosure: Trading in financial instruments and/or cryptocurrencies involves high risks including the risk of losing some, or all, of your investment amount, and may not be suitable for all investors. Prices of cryptocurrencies are extremely volatile and may be affected by external factors such as financial, regulatory or political events. Trading on margin increases the financial risks.
Before deciding to trade in financial instrument or cryptocurrencies you should be fully informed of the risks and costs associated with trading the financial markets, carefully consider your investment objectives, level of experience, and risk appetite, and seek professional advice where needed.
Fusion Media would like to remind you that the data contained in this website is not necessarily real-time nor accurate. The data and prices on the website are not necessarily provided by any market or exchange, but may be provided by market makers, and so prices may not be accurate and may differ from the actual price at any given market, meaning prices are indicative and not appropriate for trading purposes. Fusion Media and any provider of the data contained in this website will not accept liability for any loss or damage as a result of your trading, or your reliance on the information contained within this website.
It is prohibited to use, store, reproduce, display, modify, transmit or distribute the data contained in this website without the explicit prior written permission of Fusion Media and/or the data provider. All intellectual property rights are reserved by the providers and/or the exchange providing the data contained in this website.
Fusion Media may be compensated by the advertisers that appear on the website, based on your interaction with the advertisements or advertisers.
© 2007-2025 - Fusion Media Limited. All Rights Reserved.