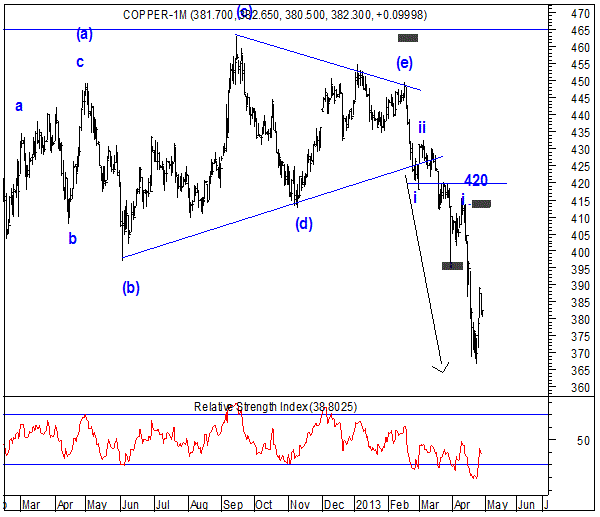
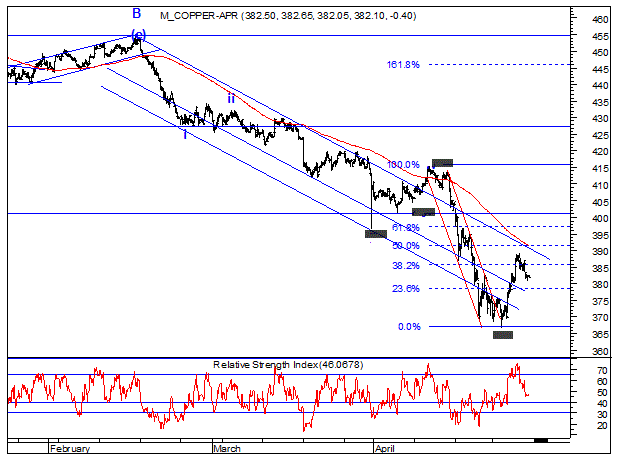
On April 15, 2013, we witnessed a sharp fall in bullions and base metals. Copper hit 1-1/2 year low thesame day. Elliott wave theory and triangle break out pattern helped us to catch the fall in MCX Copper from 430 to 370 levels, enabling us to drive the trend on downside.
MCX Copper Daily Continuous chart:
MCX Copper 60 mins chart (April Contract):
Waves Analysis: As shown above in 60 mins chart of MCX Copper, prices failed to move above upper end of the downward sloping blue channel, turning from the high of 390 and closing on a negative note.
At present, prices have arrived near the lower end of the sloping blue channel. Momentum indicator RSI has relieved the oversold position. If prices turned on upside in today’s trading session, it will form higher highs and higher lows formation, providing the first sign for the trend change.
On intraday basis, a move above will take prices higher towards the previous high. A further move above will infuse the buying pressure, and prices can move higher towards the next resistance.
The daily chart above shows triangle breakout pattern, and a violent fall in MCX Copper the last two months (arrow). A combination of Elliott Wave Theory and pattern break out suggested there is more fall remaining in this commodity over medium term.
- English (UK)
- English (India)
- English (Canada)
- English (Australia)
- English (South Africa)
- English (Philippines)
- English (Nigeria)
- Deutsch
- Español (España)
- Español (México)
- Français
- Italiano
- Nederlands
- Português (Portugal)
- Polski
- Português (Brasil)
- Русский
- Türkçe
- العربية
- Ελληνικά
- Svenska
- Suomi
- עברית
- 日本語
- 한국어
- 简体中文
- 繁體中文
- Bahasa Indonesia
- Bahasa Melayu
- ไทย
- Tiếng Việt
- हिंदी
MCX Copper: Classical Triangle Break Out Pattern
Published 04/29/2013, 07:30 AM
Updated 05/14/2017, 06:45 AM
MCX Copper: Classical Triangle Break Out Pattern
Latest comments
Loading next article…
Install Our App
Risk Disclosure: Trading in financial instruments and/or cryptocurrencies involves high risks including the risk of losing some, or all, of your investment amount, and may not be suitable for all investors. Prices of cryptocurrencies are extremely volatile and may be affected by external factors such as financial, regulatory or political events. Trading on margin increases the financial risks.
Before deciding to trade in financial instrument or cryptocurrencies you should be fully informed of the risks and costs associated with trading the financial markets, carefully consider your investment objectives, level of experience, and risk appetite, and seek professional advice where needed.
Fusion Media would like to remind you that the data contained in this website is not necessarily real-time nor accurate. The data and prices on the website are not necessarily provided by any market or exchange, but may be provided by market makers, and so prices may not be accurate and may differ from the actual price at any given market, meaning prices are indicative and not appropriate for trading purposes. Fusion Media and any provider of the data contained in this website will not accept liability for any loss or damage as a result of your trading, or your reliance on the information contained within this website.
It is prohibited to use, store, reproduce, display, modify, transmit or distribute the data contained in this website without the explicit prior written permission of Fusion Media and/or the data provider. All intellectual property rights are reserved by the providers and/or the exchange providing the data contained in this website.
Fusion Media may be compensated by the advertisers that appear on the website, based on your interaction with the advertisements or advertisers.
© 2007-2025 - Fusion Media Limited. All Rights Reserved.
