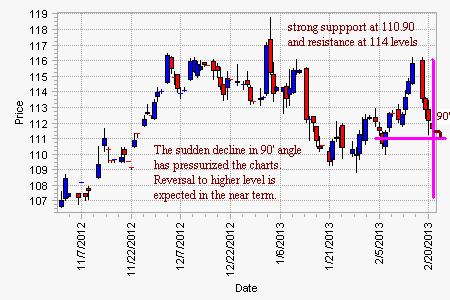
MCX aluminium February collapsed in the beginning of the week due to bearish fundamentals and profit booking. Aluminium is now trading around 111.40-112 levels.
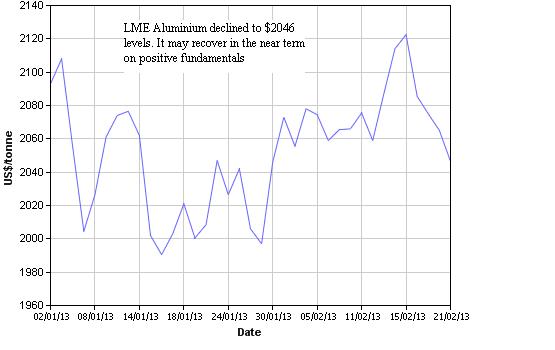
The bearish flag pattern from the beginning of the week was broken at 111.60 levels. LME aluminium collapsed from $2122 to $2046 levels as it witnessed steady fall in MCX aluminium levels. Recovery to higher level is expected.
On the charts, aluminium is showing chances of recovery. Even though it is well below the 20-day SMA at 112.64 levels, sudden decline in 90 degree angle may help reverse the market to bullish. The commodity may hold bump and run reversal or bullish flag pattern for the coming weeks.
The Stochastic level is at oversold territory and may recover to medium level. MACD is slight positive. RSI at 44.92 is neutral. Rate of change oscillator (P-ROC) has recovered to positive territory.
Sudden spike is expected as it may breach 114 levels in the coming days. Momentum may reverse on crucial fundamentals, but strong support is seen at 110.90 levels.
- S1: 111.40 S2: 110.90
- R1: 112.90 R2: 113.50
- Trend: Bullish

LME Aluminium Charts (2)

By John Godson
