McDonald’s To Bounce Back

Published 11/18/2019, 11:18 PM
Updated 07/09/2023, 06:31 AM
MCD
-
MCD Weekly Chart

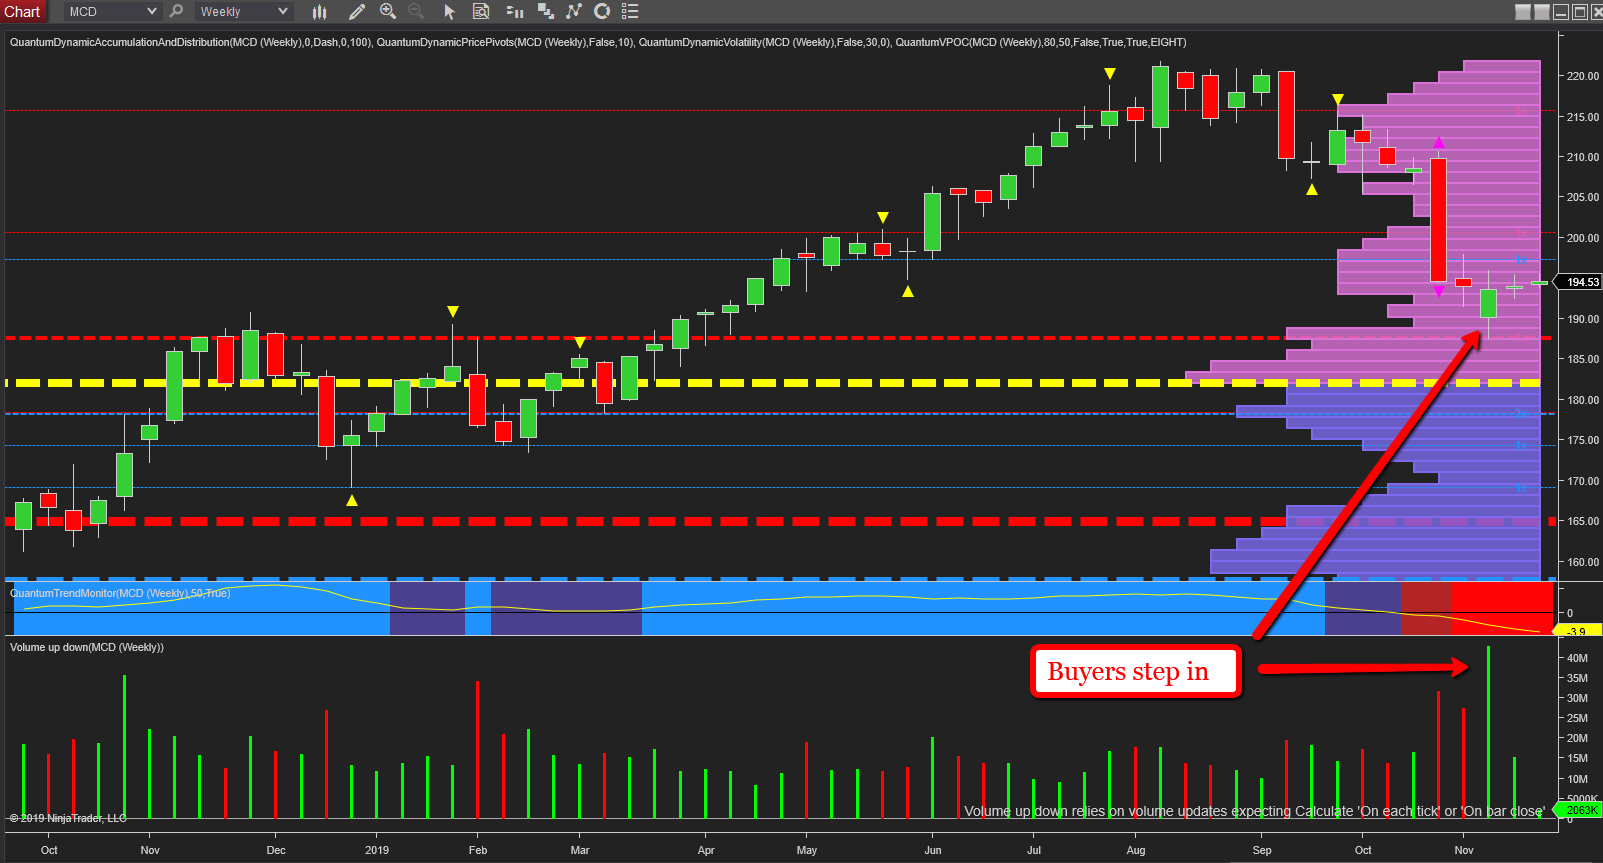
And the weekly chart for McDonald’s Corporation (NYSE:MCD) is another interesting one, but for different reasons. This is a stock I monitor closely and one I have written about extensively over the last few years, and in the last few weeks, this stock has received a double whammy of bad news. The first of these came in October with a quarterly earnings miss, the first in two years. This was then followed by the firing of CEO Steve Easterbrook. Both negative events and helping to drive the stock lower.

However, from a technical perspective, there is one volume bar which stands out head and shoulders above the others and this is on the weekly candle of two weeks ago. Note the extreme volume which is the greatest on the chart with the price candle closing higher and sending a clear signal of buying on the week. If this had been selling, the candle would have closed in the same way as of two weeks earlier. In other words, widespread and down. Here we see the reverse, where we have a narrow spread up candle on even higher volume as the buyers step in and absorb the selling pressure. The price also tested the solid platform of support below in the $187 area and denoted with the red dashed line of the accumulation and distribution indicator which duly held firm. So over the next few weeks expect to see MCD bounce back and recover.

Latest comments

Loading next article…
Risk Disclosure: Trading in financial instruments and/or cryptocurrencies involves high risks including the risk of losing some, or all, of your investment amount, and may not be suitable for all investors. Prices of cryptocurrencies are extremely volatile and may be affected by external factors such as financial, regulatory or political events. Trading on margin increases the financial risks.
Before deciding to trade in financial instrument or cryptocurrencies you should be fully informed of the risks and costs associated with trading the financial markets, carefully consider your investment objectives, level of experience, and risk appetite, and seek professional advice where needed.
Fusion Media would like to remind you that the data contained in this website is not necessarily real-time nor accurate. The data and prices on the website are not necessarily provided by any market or exchange, but may be provided by market makers, and so prices may not be accurate and may differ from the actual price at any given market, meaning prices are indicative and not appropriate for trading purposes. Fusion Media and any provider of the data contained in this website will not accept liability for any loss or damage as a result of your trading, or your reliance on the information contained within this website.
It is prohibited to use, store, reproduce, display, modify, transmit or distribute the data contained in this website without the explicit prior written permission of Fusion Media and/or the data provider. All intellectual property rights are reserved by the providers and/or the exchange providing the data contained in this website.
Fusion Media may be compensated by the advertisers that appear on the website, based on your interaction with the advertisements or advertisers.
© 2007-2025 - Fusion Media Limited. All Rights Reserved.