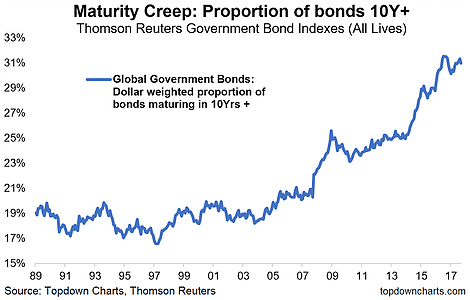
I was looking through some statistics on the global government bond markets, specifically the Thomson Reuters Government Bond Indexes. A couple of key metrics and trends struck me as a big shift in the risk and return make up of global government bond markets has taken place.
The chart of interest comes from my latest weekly report where I looked at the issue, as it pertained to investing from a top-down, multi-asset perspective.
The key chart shows maturity creep in the global government bond markets: the "market cap" weighted proportion of bonds with a maturity of 10+ years growing from around 17% at the low point in 1997, to now just over 30%.

The global bond universe in this case includes all developed markets and major emerging markets (included from 2007). The value of the 10-years and beyond maturity bucket is divided by total bonds outstanding for each country, and the composite displayed shows the global "market capitalization" weighted proportion (with weights calculated using IMF PPP values to translate into a common currency).
The clear increase in the proportion of longer term bond issuance over time is one of the key factors which has contributed to the global composite duration (a measure of interest rate risk) figure rising from 4.5 in 1990 to now around 7 - an almost doubling in interest rate sensitivity, or risk.
At the same time the weighted average yield has fallen from around 9% to 2% or in real terms from around 4% to 0%. Lower yields mean lower expected returns.
So you have a combination of higher risk and lower expected returns. Little wonder then that most active asset allocators I speak to remain underweight bonds. Indeed, if it weren't for their diversification benefits (hopefully!) it would be like "why bother?"
