Markets to watch this week
Daily Chart: 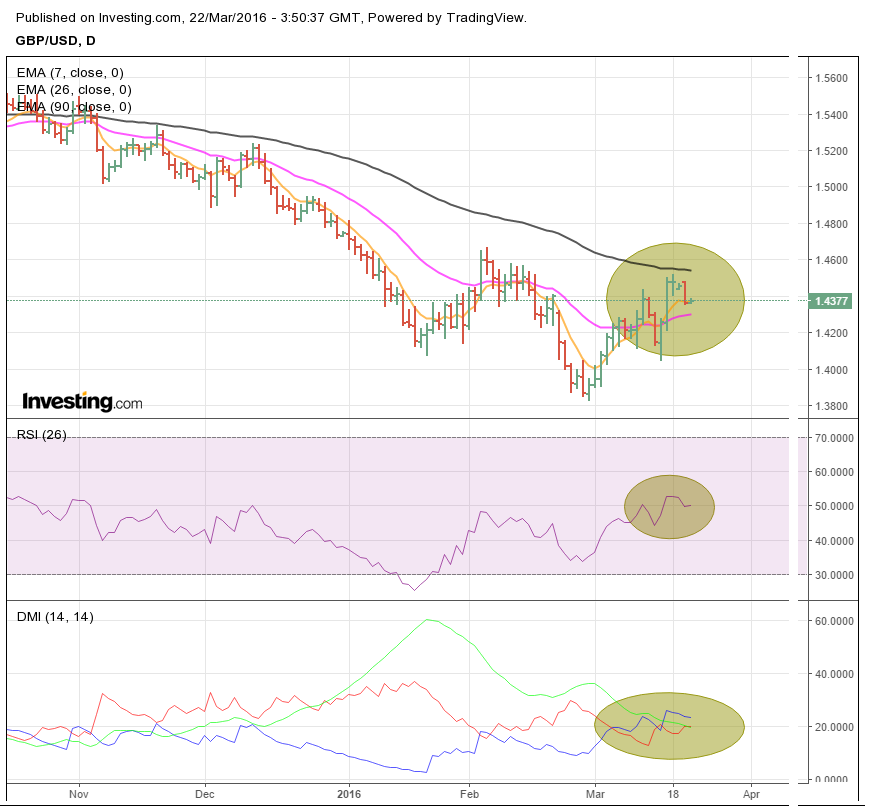
*Price has moved above the 7P (7 period) and 26P EMA and the 7P has moved above the 26P EMA
*26P RSI has broken above 50 and appears to be holding
*+DI has crossed above -DI
Scenario - the 90P EMA holds price and 7P/26P EMA limiting the correction to the current highs achieved
Scenario - The price bounces off of the 7/26P EMA as support and breaks through the 90P EMA. This scenario would be similar to the AUD/USD and CAD/USD movement but as a lager
One strategy could be to place a buy in the price range between the 7 and 26P EMA with a close stop.
Another strategy could be to wait for price to break above the 90P EMA and wait for a pullback from that to buy.
Daily Chart: 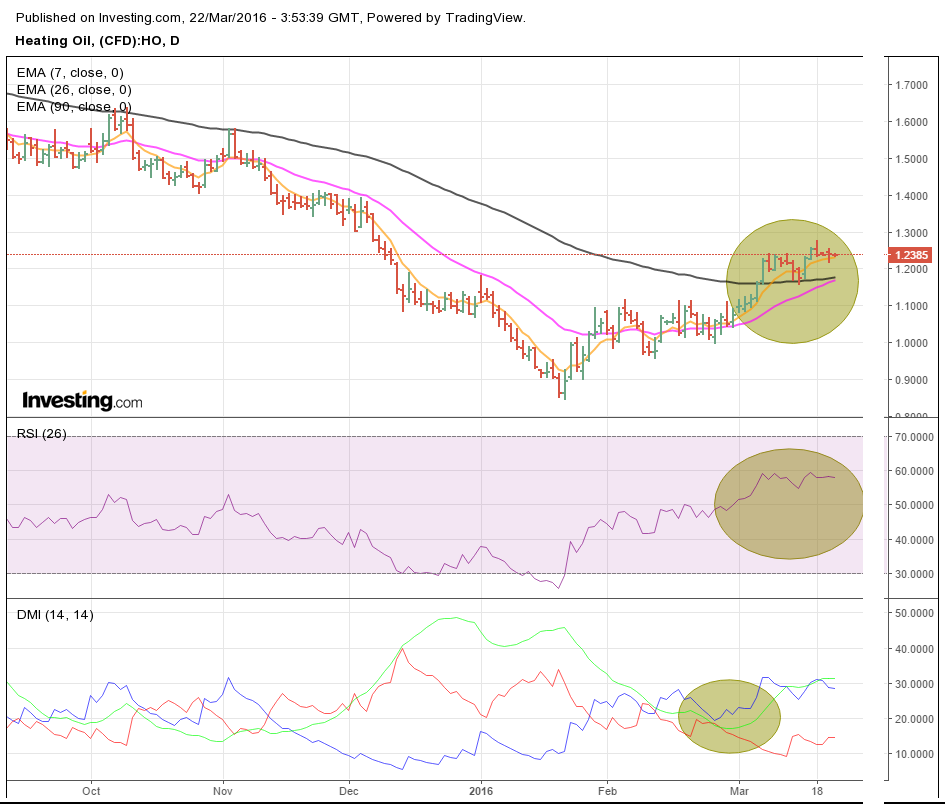
*Price and 7P EMA has broken above 90P
*26P RSI is above 50
*+DI is above -DI
Most of these conditions occurred several weeks back and provided a more probable entry point then. However, with the price move above the 90P EMA which is now providing support, a pullback into the area between the 7P and 90P EMA may provide a buying opportunity.
One strategy could be to buy at the 90P EMA and place a close stop just below. This should see the 26P RSI move down to 50 and hold along with the +DI and -DI converge somewhat.
Another strategy could be to place a buy above the 7P EMA on a pullback with a stop below the 90P EMA. This would be a more aggressive strategy because price could continue through the 90P. However, the market may move up and not pullback any further than it has.
Daily Chart: 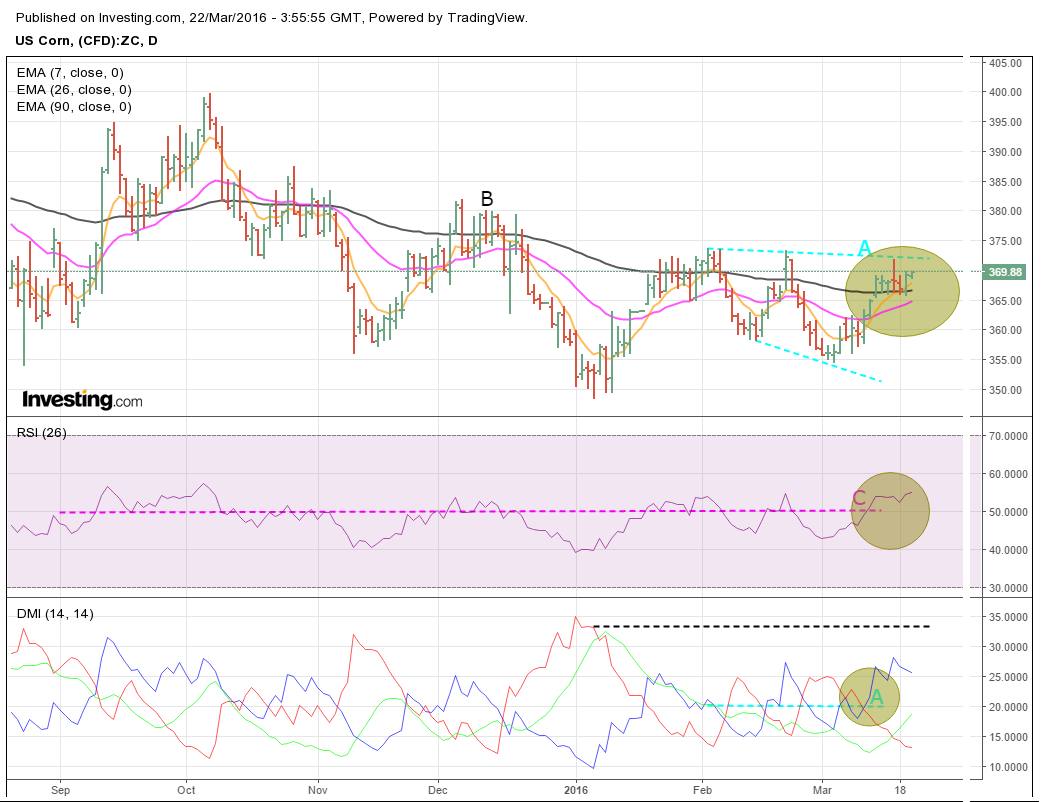
*Price has moved above the 7/26/90P EMA
*26P RSI has moved and held above 50
*+DI has moved above -DI
*ADX has tracked below 20 and/or +/-DI for several months allowing for price consolidation (A)
As it sits now, it still unclear if price is staged to go higher or not as corn has recently had these setups earlier this year. Entry at this point would seem to be high risk.
Close attention should be paid to price and if it were to break the resistance line (A), then a pullback from the break could be an ideal place to enter long position.
Daily Chart: 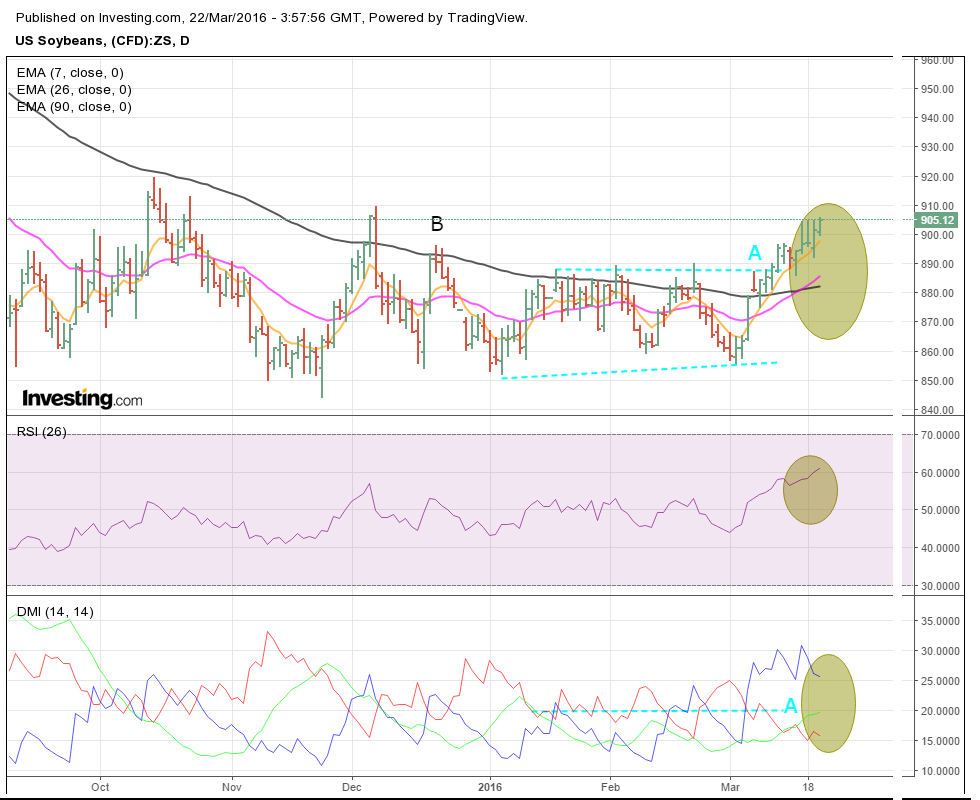
*Price has made a clear break above 90P EMA
*7 and 26P EMA have moved above the 90P EMA
*26P RSI has moved well above 50
*+DI has moved above -DI
*Price has broken above support created by the ADX tracking below 20 and/or +/-DI
The market broke through key resistance without any significant pullback.
A possible strategy would be to wait for the market to pull back into the 26P or 90P EMA to enter on the market on the long side. This movement should see the 26P RSI pull back toward 50 and a convergence of the +/-DI. As for entry into the market, time should be allowed to evolve the market.
Daily Chart: 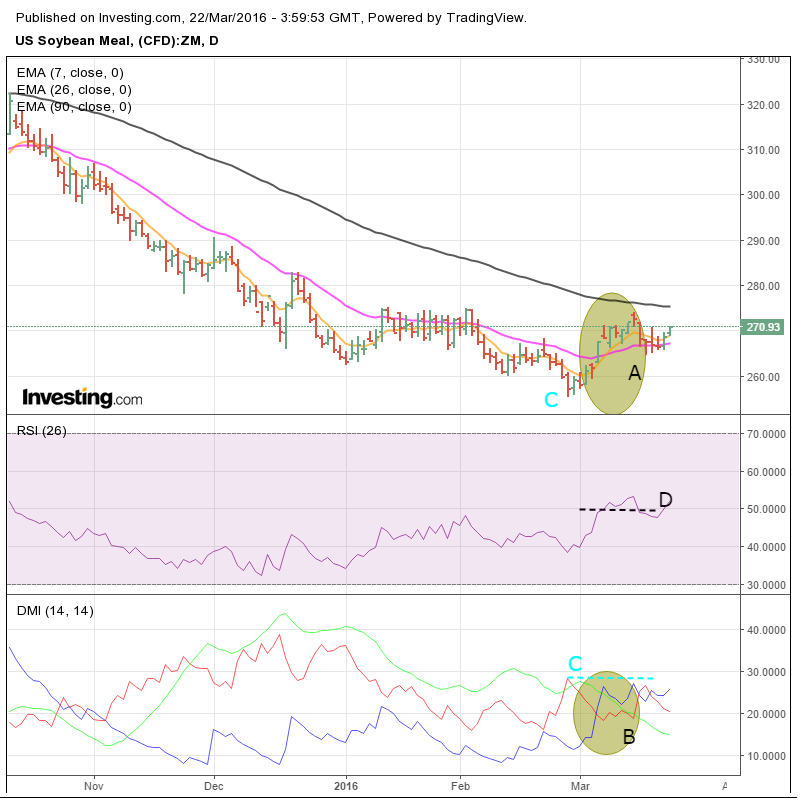
*7P EMA and price has crossed above the 26P EMA
*26P has moved above and held 50
*+/-DI is somewhat inconsistent with the other indicators as the ADX is below 20 and the +/-DI indicating a consolidation in price is setting up
Continue to watch price to see what it does at the 90P EMA. With the behavior of the ADX, it is possible that price could bounce between the 90P and 26P EMA for several days before breaking out
Daily Chart: 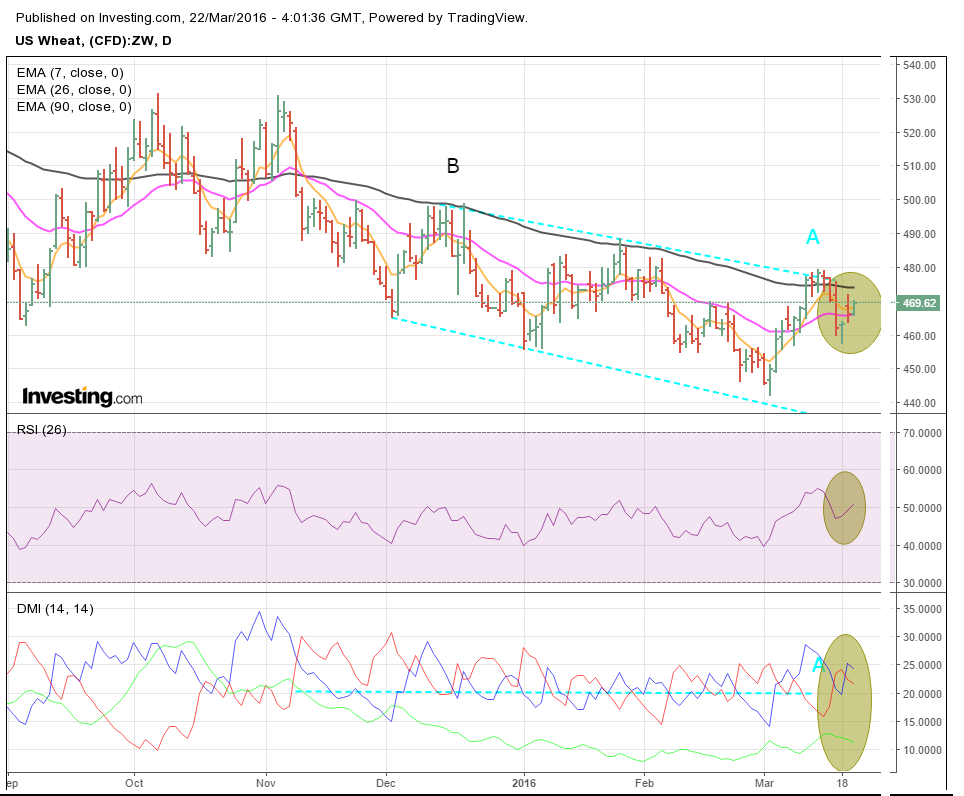
*7P has moved above the 26P EMA and has held
*Price backed off the 90P EMA
*26P RSI is holding in the 50 range
*ADX has tracked below 20 since November as the market has drifted down
The market has held a nice channel since December 2015. During this timeframe, the 90P EMA hasn't really has a close in price above it and the 26P RSI has not been breached as I it has in March.
One strategy could be to go long now and place a stop below the 26P EMA.
A second strategy could be to continue to watch price watching for the 90P EMA to be penetrated by price again. Should this happen, the ADX should turn up with +DI pulled through too. Once the resistance is broken along with the 90P EMA, then any pullback could be used as a buying opportunity.
