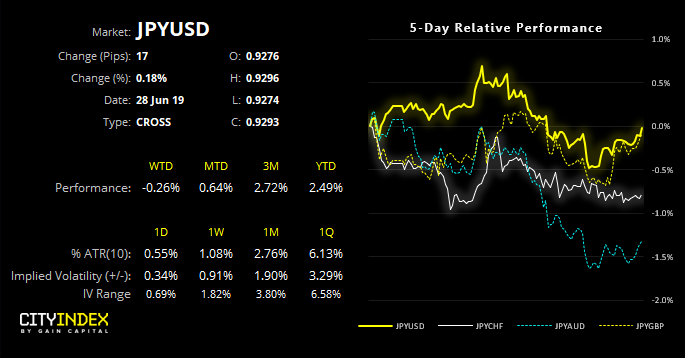
The meetings have kicked-off and volatility remains capped whilst traders await potentially market-moving headlines and trade developments. We take a look at a couple of JPY pairs around the event.
Markets were given a gentle lift in sprits yesterday on announcement that the US and China had agreed to a trade truce ahead of the G20 talks. And today, Trump has since agreed to no preconditions for his meeting with Xi. Whilst these developments do little to confirm talks will ultimately become a success, they’re a step in the right direction and a much softer approach than Trump has known to take ahead of other, key events. That said, Trump has lined up no fewer than nine bilateral meetings for the event, most likely in a bid to pile on the pressure on Xi for a more favourable meeting tomorrow.
THURSDAY
23:30 GMT Japanese Prime Minister Shinzo Abe
FRIDAY
00:15 GMT Bilateral meeting with Abe and Indian Prime Minister Narendra Modi
00:35 GMT Modi
0115 GMT German Chancellor Angela Merkel
0500 GMT Russian President Vladimir Putin
06:30 GMT Brazilian President Jair Bolsonaro
23:15 GMT Saudi Crown Prince Mohammed bin Salman
SATURDAY
02:30 GMT Chinese President Xi Jinping
04:05 GMT Turkish President Tayyip Erdogan
For now, markets are on tenterhooks as they await developments of the meeting. However, it’s possible we may have to wait until markets are closed for the weekend before the more meaningful headlines hit the screens, which could leave markets vulnerable to gaps on Monday. But with markets focussed on the success or failure of the Trump-Xi talks, it could have a binary effect on Monday mornings open and subsequent moves. In short, successful talks could see less demand for safe havens (JPY, CHF, gold, bonds etc) and demand for riskier assets (Equities, commodity FX - AUD, NZD, CAD) and the reverse could be true if deemed a failure.
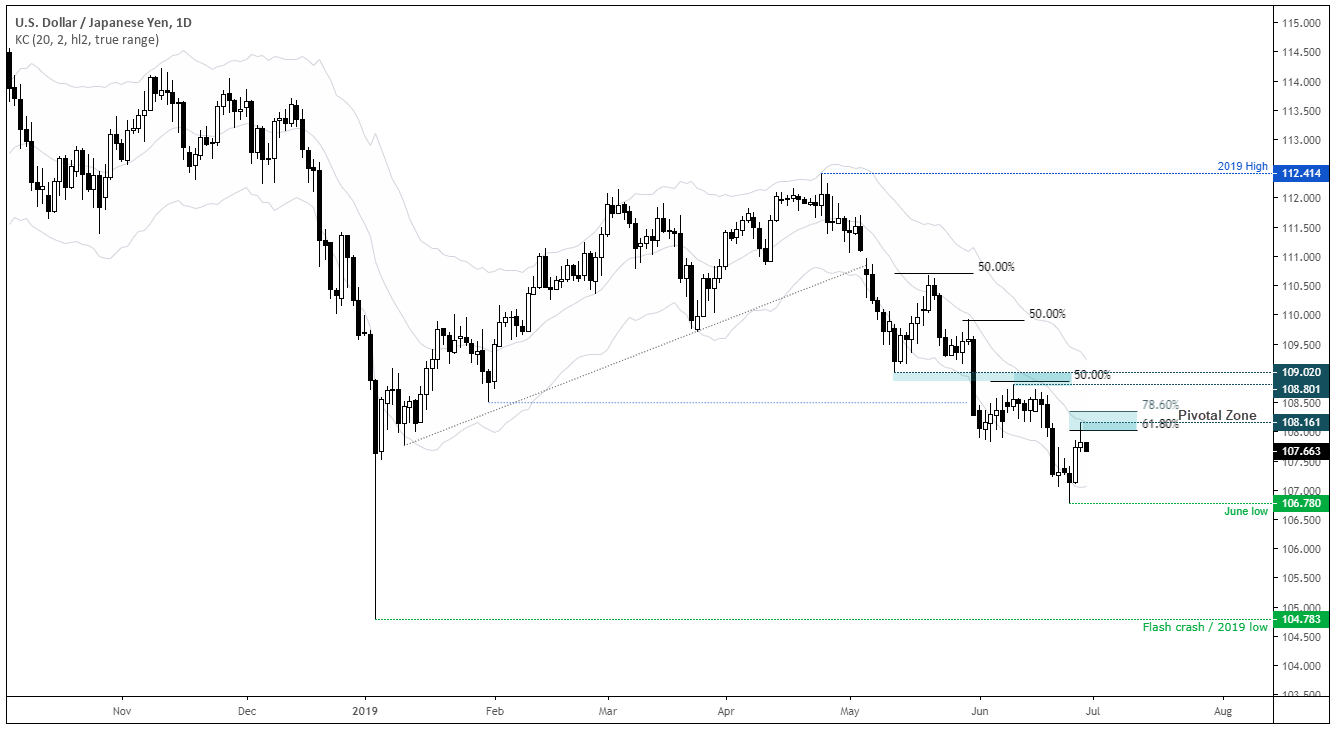
Technically USD/JPY remains in a downtrend, although its seen a retracement from its lows.
- A bearish pinbar has respected the 20-day eMA and 61.8% Fibonacci level, and bearish swing traders could look to fade into moved around this resistance area.
- However, during its decline it’s the first retracement that’s surpassed the 50% level to suggest a subtle shift in sentiment at the lows.
- Regardless, we’d be interested in short positions if the bearish structure holds below the 78.6% Fibonacci level.
- This would assume G20 talks see demand for JPY crosses ahead of the weekend or after Monday’s open.
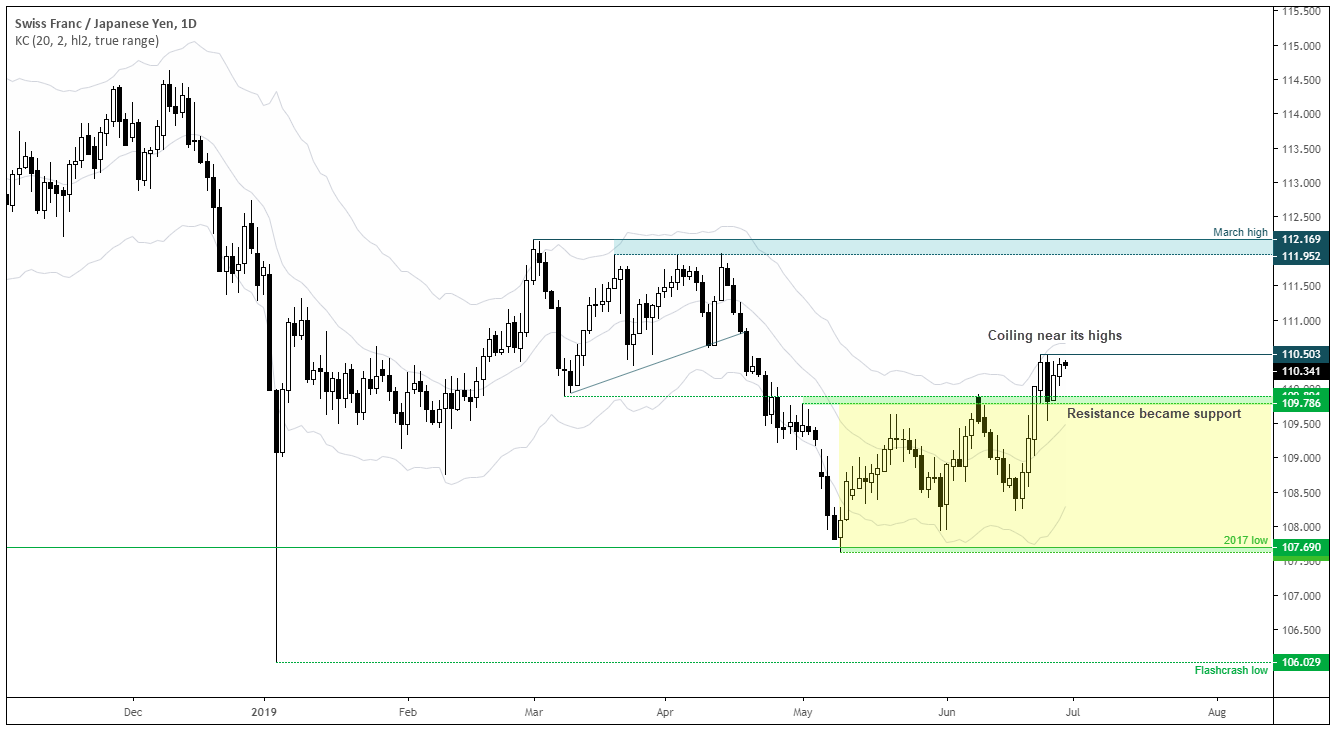
If we were to seek a bullish scenario around G20 talks, CHF/JPY could make an interesting setup, even if less of an obvious choice.
- The cross has produced two higher lows above the 2017 low and now broken out of its 230 pip range.
- Moreover, price action is building a base above the breakout level and compressing near its highs.
- A direct above the highs assumes trend continuation and reaffirms its position in a new range between the 110 – 112 area.
- A break back below key support takes it back within range and labels it a fakeout / bull trap.


