Markets On Tenterhooks Ahead Of Draghi’s Finale; EUR/CHF, EUR/AUD, EUR/NZD

Published 09/12/2019, 03:04 AM
EUR/USD
-
EUR/CHF
-
EUR/AUD
-
EUR/NZD
-

Draghi’s final meeting is just hours away, with several Euro crosses sitting on ‘make or break’ levels.
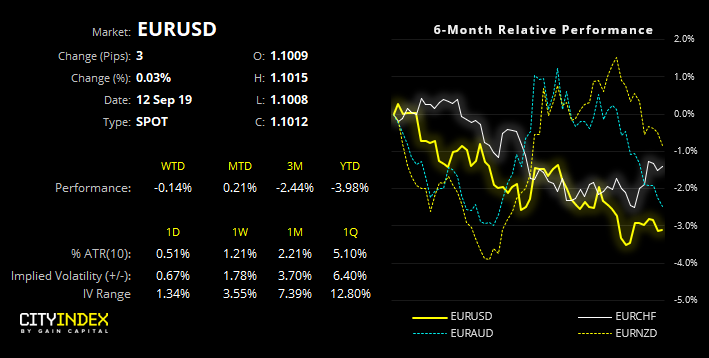
EUR/USD Chart

For a full preview of what to expect from today’s ECB meeting, you can read yesterday’s ECB preview by my colleague Fiona Cincotta’s. Although the basic premise is for Euro to weaken if ECB underdeliver, or strengthen if they come up with the goods. With it being Draghi’s last meeting, he could opt to just cut rates and leave the door open for his successor, Christine Lagarde to take over. Unless of course he wants to go with a bang. Either way, the Euro will be the main currency for FX traders to monitor in the upcoming European session.
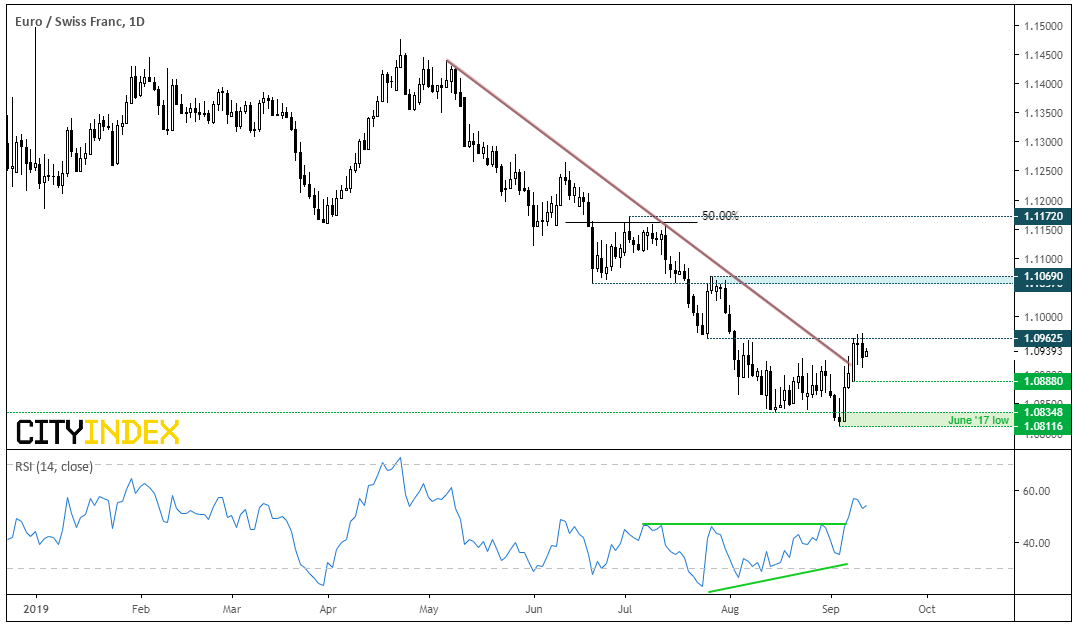
EUR/Swiss Daily Chart

EUR/CHF remains supported after breaking its bearish trendline on Monday. That said, we’ve seen a Rikshaw Man doji to show a hesitancy to break higher, followed by a bearish outside day to warn of a correction. Yet whilst it remains above the 1.0882 low, we suspect a reversal is underway, given the bullish divergence ahead of the trendline break.
  • We’d like to see Monday’s low at 1.0888 to hold as support, and could provide an area to buy dips post-shakeout if volatility erupts before direction takes off.
  • As clear break of Monday’s low assumes ECB delivered, and could head back to the lows. Which will be interesting, given SNB have intervened with the Swiss franc to help cushion the fall on EUR/CHF.
  • EUR/AUD Daily Chart

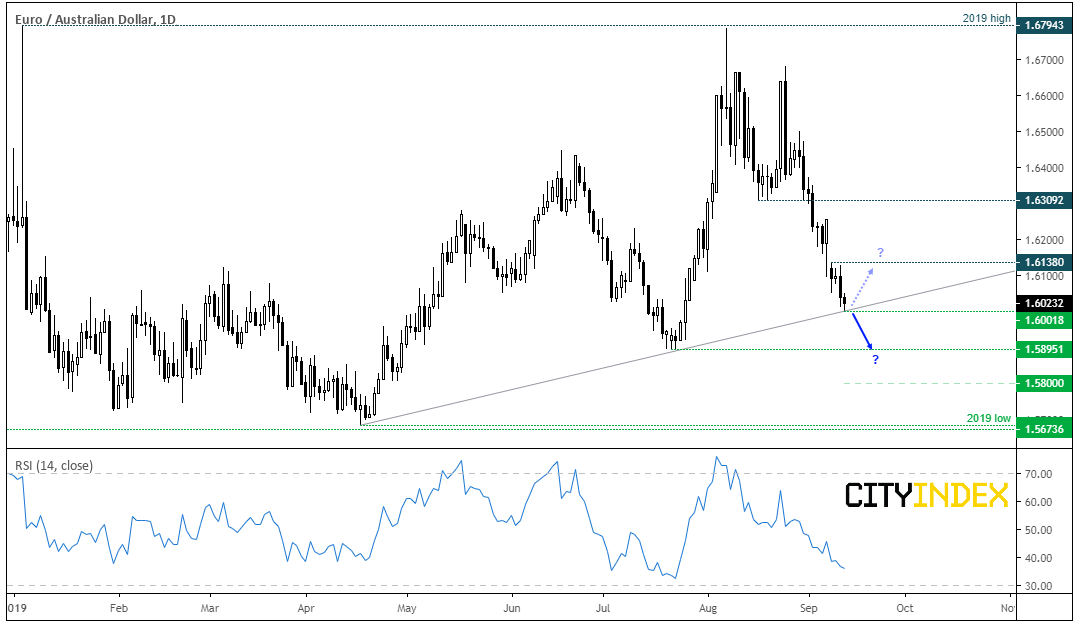
    EUR/AUD is currently testing the bullish trendline from the April low, and currently forming a spinning top ahead of the ECB meeting (we doubt it will maintain this pattern to the close). As it’s testing its trendline, it could be argued the optimal trade were if the ECB is to disappoint and send EUR/AUD higher.
  • Bulls could consider entering long above the trendline (if ECB disappoints and sends Euro broadly higher) and initially target the 1.6138 high.
  • Given the pair’s ability to produce large swings, a break above 1.6138 could suggest the low is in and bulls could push it back towards 1.6309.
  • If ECB deliver the goods, we’d expect the trendline to break and for prices to test the 1.5895 low. A break of which would bring 1.5800 and the 2019 low into focus.
  • With no signs of a bullish divergence of trough forming on price action, a trendline break could be on the cards whilst prices remain below 1.6138.
  • EUR/NZD Daily Chart

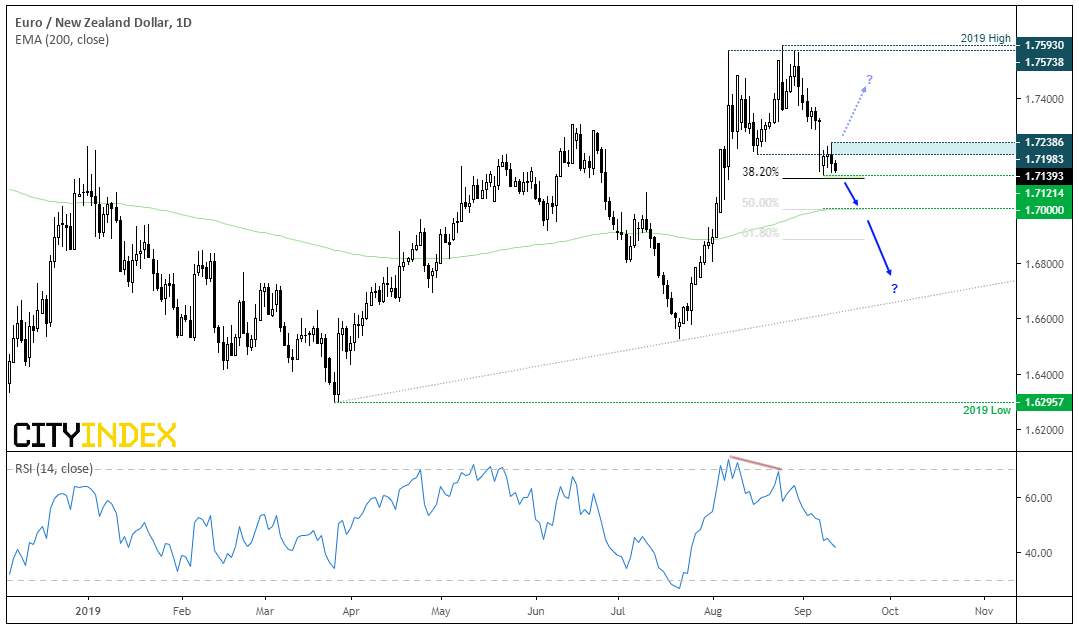
    EUR/NZD almost looks like EUR/AUD did a few weeks back, only its yet to test its bullish trendline. Currently trading within a 120-pip range after falling from its 2019 highs, a bearish divergence formed with RSI before rolling over and prices are trading near the lows of the 1.7121-1.7240 range.

  • Given the strength of momentum from the 1.7893 high, and EUR/NZD’s tendency to produce large swings, the bias is for a bearish breakout and run towards the lower trendline.
  • Traders could wait for a break of the 38.2% Fibonacci ratio for confirmation of a break, and use 1.7000 as a interim target where the 200-day MA and 50% retracement level reside.
  • A break above 1.7240 today assumes Draghi delivered the goods and the near-term bias flips to bullish. However, we’d continue to monitor price action for a potential topping pattern (or a lower high) as we suspect the leg lower from the 2019 high has more to give.
  • Original Post

    Latest comments

    Loading next article…
    Risk Disclosure: Trading in financial instruments and/or cryptocurrencies involves high risks including the risk of losing some, or all, of your investment amount, and may not be suitable for all investors. Prices of cryptocurrencies are extremely volatile and may be affected by external factors such as financial, regulatory or political events. Trading on margin increases the financial risks.
    Before deciding to trade in financial instrument or cryptocurrencies you should be fully informed of the risks and costs associated with trading the financial markets, carefully consider your investment objectives, level of experience, and risk appetite, and seek professional advice where needed.
    Fusion Media would like to remind you that the data contained in this website is not necessarily real-time nor accurate. The data and prices on the website are not necessarily provided by any market or exchange, but may be provided by market makers, and so prices may not be accurate and may differ from the actual price at any given market, meaning prices are indicative and not appropriate for trading purposes. Fusion Media and any provider of the data contained in this website will not accept liability for any loss or damage as a result of your trading, or your reliance on the information contained within this website.
    It is prohibited to use, store, reproduce, display, modify, transmit or distribute the data contained in this website without the explicit prior written permission of Fusion Media and/or the data provider. All intellectual property rights are reserved by the providers and/or the exchange providing the data contained in this website.
    Fusion Media may be compensated by the advertisers that appear on the website, based on your interaction with the advertisements or advertisers.
    © 2007-2025 - Fusion Media Limited. All Rights Reserved.