Summary
- International manufacturing data is still soft.
Key International Data
China/Japan/Australia
China
Japan
Australia
Asia conclusion: the good news is that China's manufacturing picked up due to an increase in orders. Even though it's weak, it's still encouraging. But Japan's and Australia's indexes were softer, as were readings from most other Asian countries. The trade war is sill hurting.
Canada/Mexico
Canada
Mexico
Canada/Mexico conclusion: Although Canada is still growing, the Bank of Canada is projecting a slowdown in the next few quarters. Mexico is now in a technical recession.
UK/EU
EU
UK
UK/EU Conclusion: The UK is still suffering from the negative impacts of Brexit, which is depressing order books and sentiment. Business is doing the least amount possible to keep their businesses running while not committing to major capital expansions. The EU is still expanding, but the manufacturing sector is still hurting from the trade war.
Key Central Bank Actions
The Bank of Canada kept rates at 1.75%. Here's how the bank described the Canadian economy (emphasis added):
Growth in Canada is expected to slow in the second half of this year to a rate below its potential. This reflects the uncertainty associated with trade conflicts, continuing adjustment in the energy sector, and the unwinding of temporary factors that boosted growth in the second quarter. Business investment and exports are likely to contract before expanding again in 2020 and 2021. At the same time, government spending and lower borrowing rates are supporting domestic demand, and activity in the services sector remains robust. Employment is showing continuing strength and wage growth is picking up, although with some variation among regions. Consumer spending has been choppy, but will be supported by solid income growth. Meanwhile, housing activity is picking up in most markets. The Bank continues to monitor the evolution of financial vulnerabilities in light of lower mortgage rates and past changes to housing market policies.
After slowing in 4Q18 and 1Q19, the Canadian economy grew 3.7% in 2Q19. Although unemployment has fluctuated between 5.4% and 5.8% during the last 12 months, retails sales have been soft during the last four months, expanding between 0.7% and 1.4% Y/Y. The manufacturing PMI has been below 50 in four of the last six months, which explains the soft industrial production readings (data from tradingeconomics.com).
The Bank of Japan voted to maintain its current rate program.They also re-issued the following statement about future interest rate policy:
As for the policy rates, the Bank expects short-and long-term interest rates to remain at their presentor lower levels as long as it is necessary to pay close attention to the possibility that the momentum toward achieving the price stability target will be lost.
The Japanese economy lost momentum in the third and fourth quarter of 2018, only growing 0.1% and 0.3% Y/Y, respectively. Activity picked up during the 1H19, rising to a 1% Y/Y rate in the first and second quarters. Despite low unemployment, retail sales have been weak: they grew between 0.4% and 1.8% Y/Y since November 2018 (while they increased 9.1% in the latest month, this is due to a tax increase going into effect). The manufacturing PMI has been below 50 in eight of the last nine months, explaining why industrial production contracted in seven of the last 12 months. However, the service sector PMI has been above 50 for the last year. (data from trading economics.com)
Brazil lowered rates 50 basis points to 5%. Brazil's central bank is only focused on price stability:
Inflation expectations for 2019, 2020, 2021, and 2022 collected by the Focus survey are around 3.3%, 3.6%, 3.75%, and 3.5%, respectively;
The Copom's inflation projections in the scenario with interest rate and exchange rate paths extracted from the Focus survey stand around 3.4% for 2019, 3.6% for 2020, and 3.5% for 2021. This scenario assumes a path for the Selic rate that ends 2019 at 4.50% p.a., remains at that level during 2020, and ends 2021 at 6.38% p.a. It also assumes a path for the exchange rate that ends 2019 at BRL/USD 4.00, remains at that level during 2020, and ends 2021 at BRL/USD 3.95; and
Brazil's economy is weak for a developing country. GDP has grown at an annual pace between 0.5%-1.3% the last four quarters -- a low pace for an emerging economy. The unemployment rate has been stable at 11.8% since July. Retail sales have fluctuated between 0.1% and 4.5% since last October (they did contract 4.4% one month). Manufacturing sentiment has been above 50 the last three months; it contracted between May-July and the Service sector PMI exhibited the same pattern. Industrial production declined in 8 of the last 12 months. (data from tradingeconomics.com)
Key US Data
The Fed lowered rates 25 basis points to 1.5% from 1.75%. Here is how they described the current state of the US economy:
Information received since the Federal Open Market Committee met in September indicates that the labor market remains strong and that economic activity has been rising at a moderate rate. Job gains have been solid, on average, in recent months, and the unemployment rate has remained low. Although household spending has been rising at a strong pace, business fixed investment and exports remain weak. On a 12-month basis, overall inflation and inflation for items other than food and energy are running below 2 percent. Market-based measures of inflation compensation remain low; survey-based measures of longer-term inflation expectations are little changed.
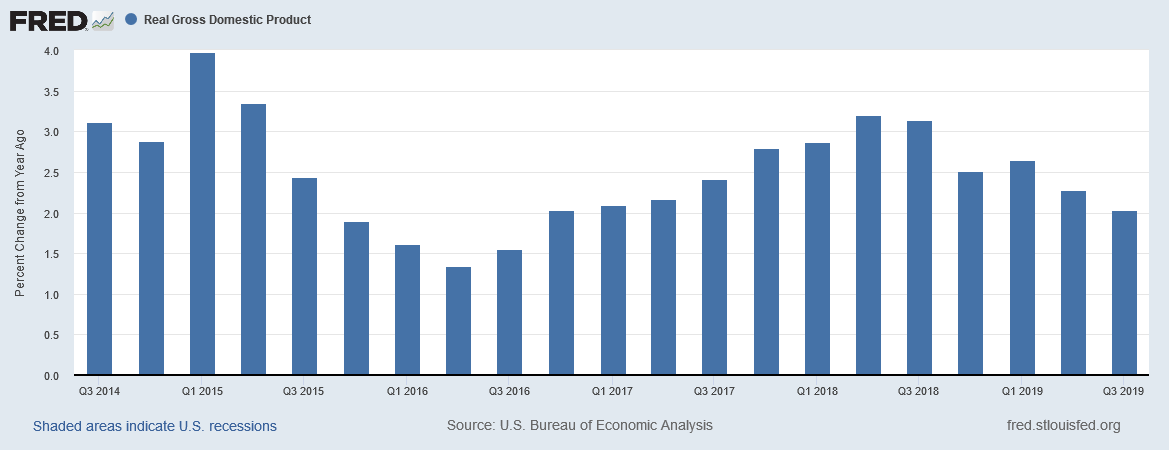
The Fed's assessment was confirmed by the BEA's two key macro releases: GDP and monthly personal consumption expenditures. The former was up 1.9% Q/Q and 2% Y/Y while the latter increased 0.2% M/M and 2.6% Y/Y. Let's combine these two reports to get an overall view of the US economy, starting with the Y/Y percentage change in real GDP:
Overall, growth continues apace. It rose from slightly under 1.5% in 2Q15 to slightly more than 3% in the second and third quarter of 2018. It has trended modestly lower since and was 2% in the latest release.
After an early-year lull, consumer spending has returned to a steady rate of growth:
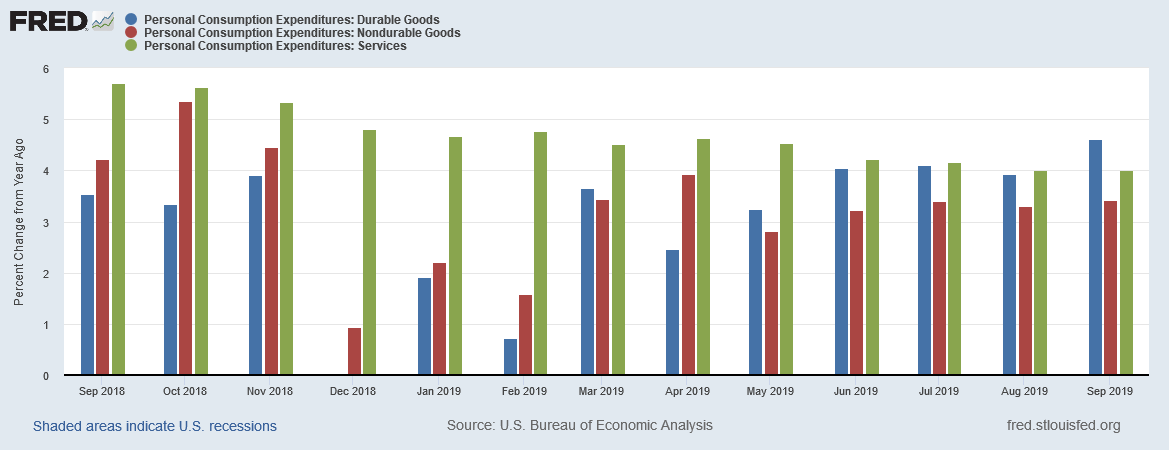
The above chart shows the monthly Y/Y percentage change in the three sub-categories of personal consumption expenditures: durable goods (in blue), non-durable goods (in red), and services (in green). With the exception of services, spending decreased in December through February. Spending has since returned to its steady state of growth.
Investment, however, is a different story:
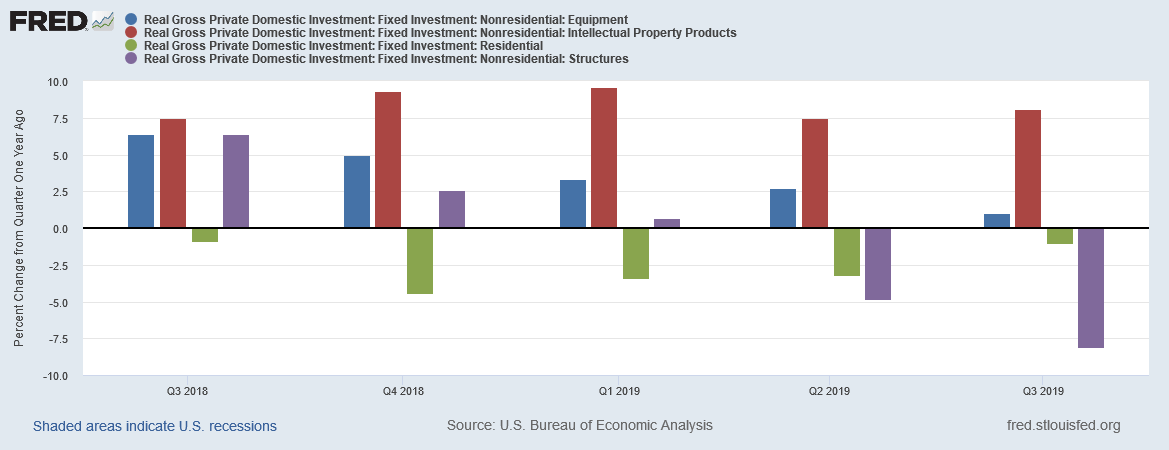
Intellectual property spending (in red) has been steady. But equipment expenditures (in blue) have steadily declined over the last year; residential investment (in green) has contracted for the last five quarters; non-residential structure spending (in purple) has declined the last two quarters. The above data indicates that business has definitely decided to take a wait-and-see attitude to expanding.
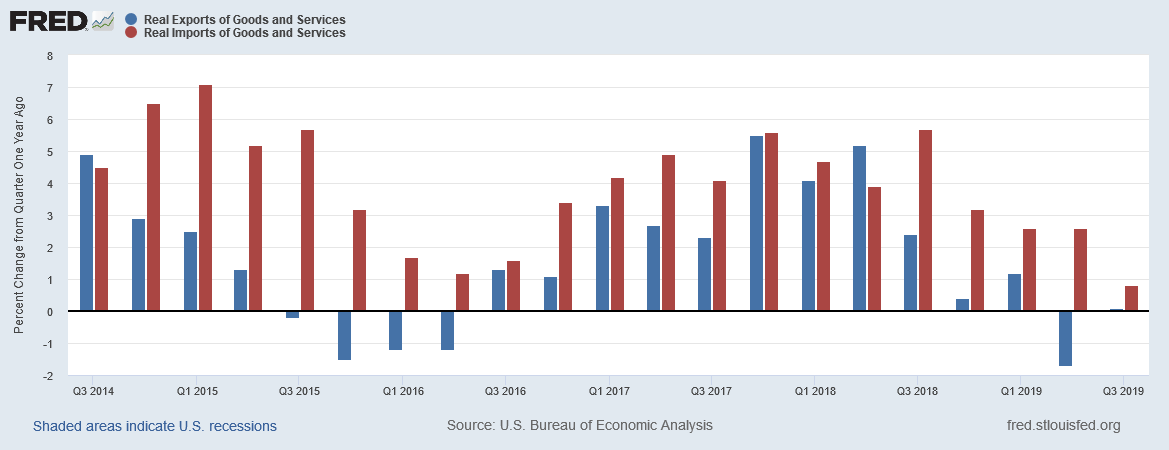
Exports and imports are both declining as well (all data Y/Y). Exports (in blue) peaked in 4Q17 and contracted in the latest report. Imports (in red) have been declining for the last four quarters.
On Friday, the BLS released the latest employment report (emphasis added):
Total nonfarm payroll employment rose by 128,000 in October, and the unemployment rate was little changed at 3.6 percent, the U.S. Bureau of Labor Statistics reported today. Notable job gains occurred in food services and drinking places, social assistance, and financial activities. Within manufacturing, employment in motor vehicles and parts decreased due to strike activity. Federal government employment was down, reflecting a drop in the number of temporary jobs for the 2020 Census.
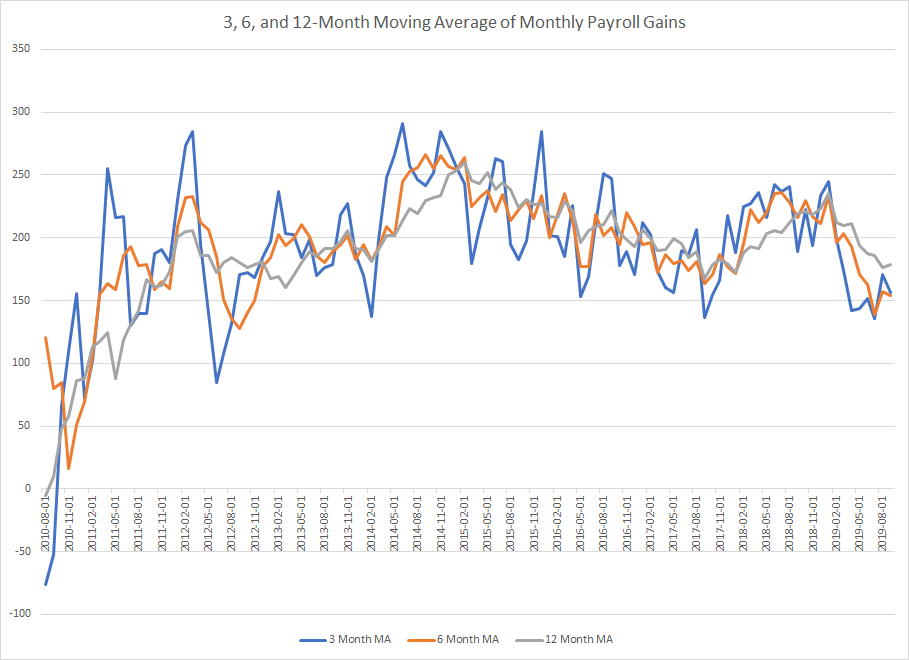
To remove the monthly noise, the following chart uses 3, 6, and 12-month moving averages of the monthly gains in establishment jobs:
Data from the St. Louis Federal Reserve; author's calculations
The number is trending lower; all three averages appear to be coalescing slightly above the 150,000 level. This shouldn't be surprising since the unemployment rate is 3.6% and the expansion is over 10 years old.
US Conclusion: the US economy is in good shape. While growth has slowed, the economy is still growing at a consistent pace. Even though employment growth has slowed, it's still growing at slightly more than 150,000/month, which should be a sufficient pace to keep the consumer spending. Soft investment spending is concerning, but that accounts for a far smaller portion of overall US growth.
US Markets
Let's start with this week's performance table:
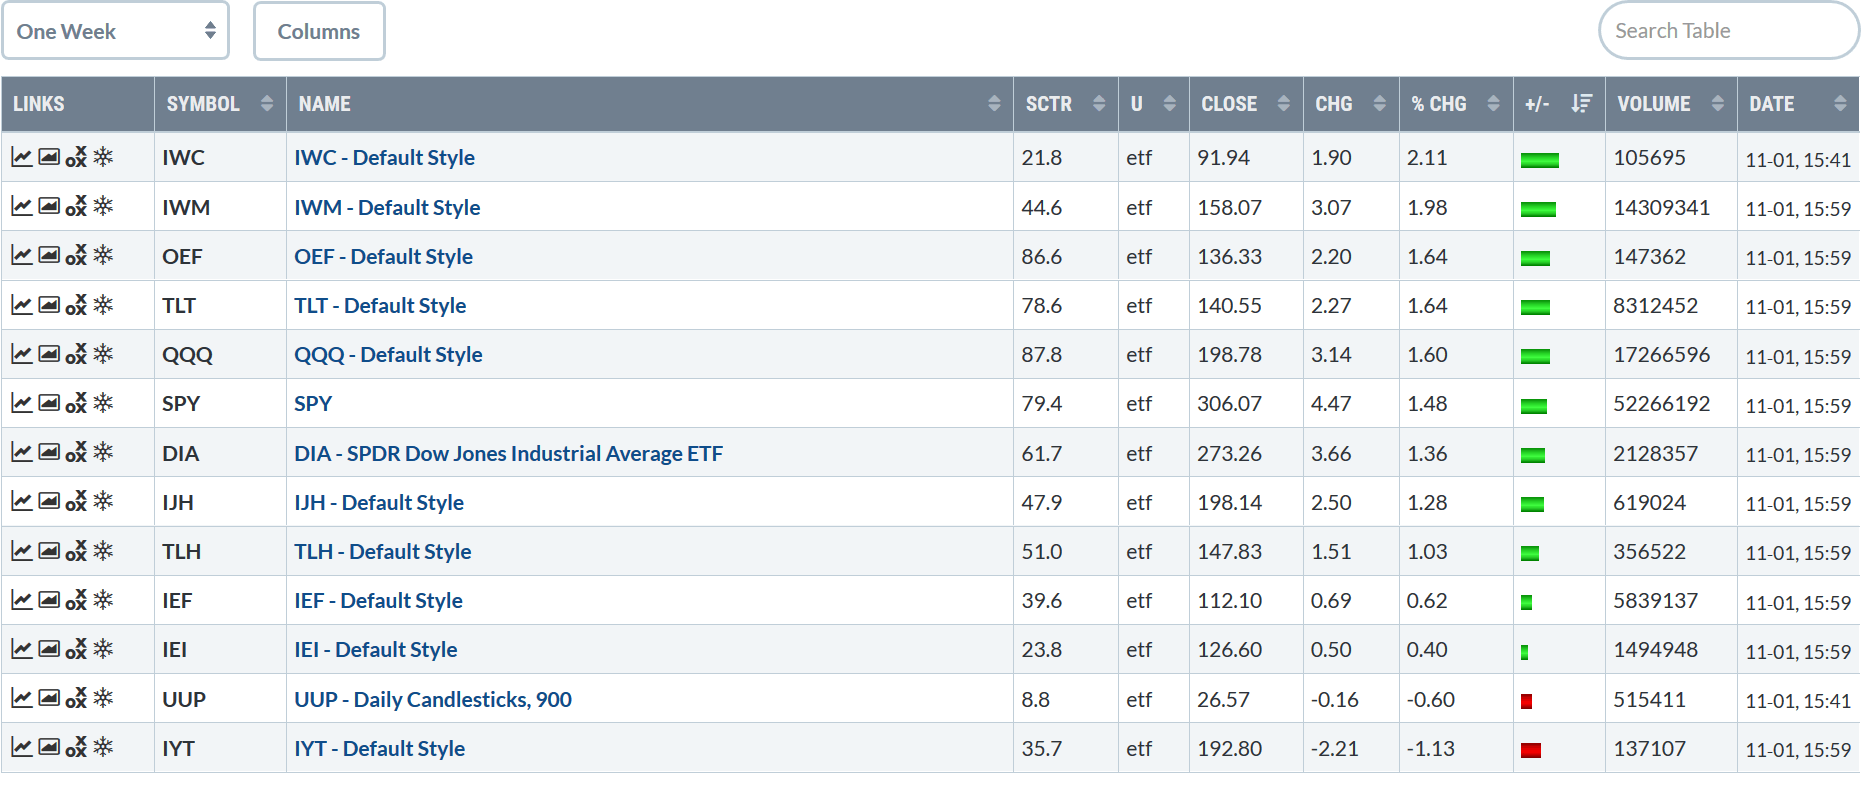
There's some good news above for the bulls. First, the equity markets moved higher this week. And second, small-caps led the way higher. Micros are at the top, gaining 2.11%. Small-caps aren't far behind, rising a little under 2%. QQQ and SPY were each higher as well. The long end of the Treasury market caught a bid from the Fed cuts.
The sector performance is bullish as well:
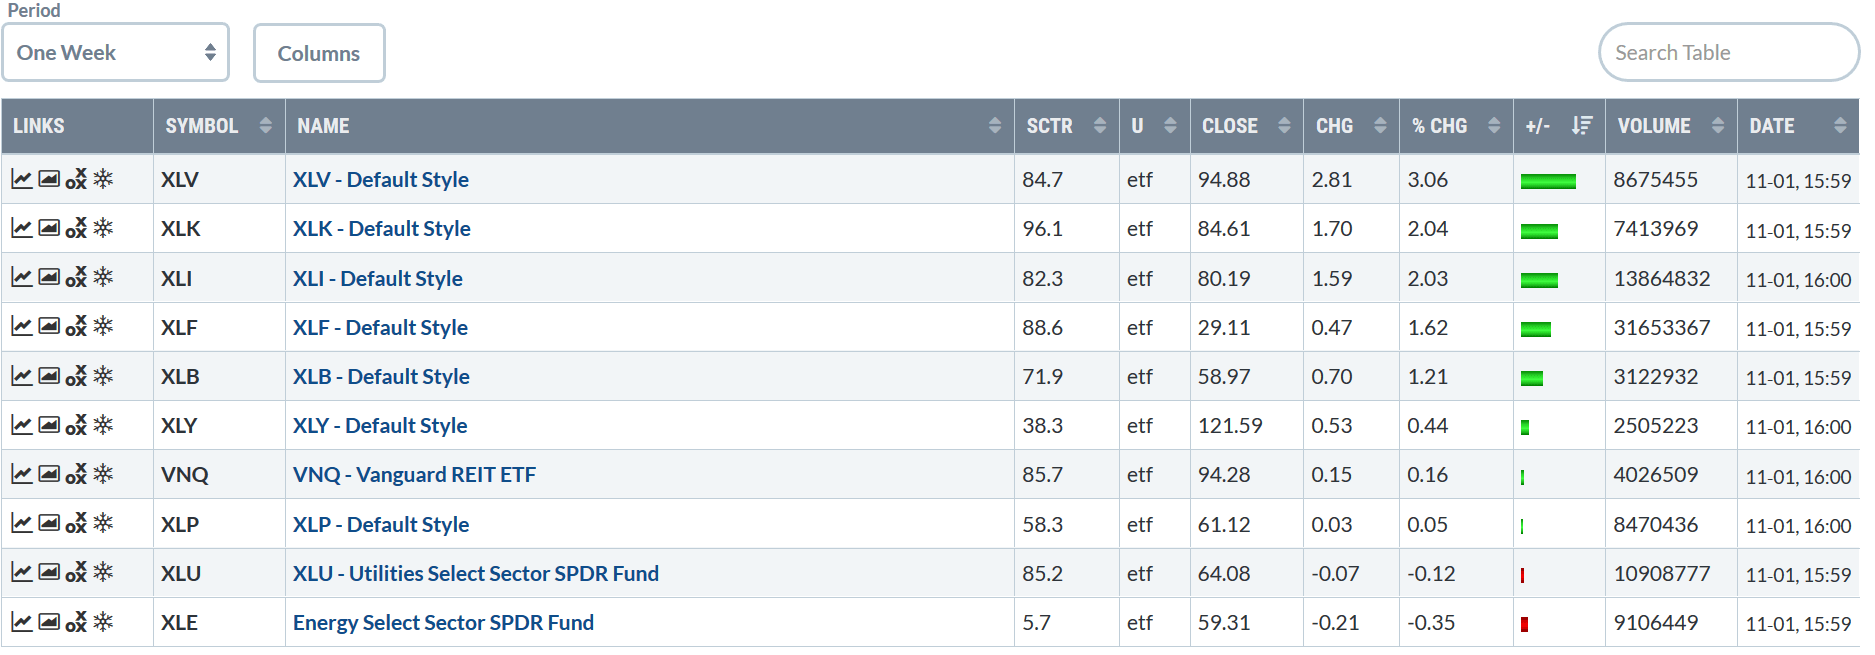
Healthcare was higher thanks to some strong earnings reports. But tech, industrial, and financials -- all bullish sectors -- hold the 2, 3, and 4 spots above. The three main defensive sectors -- real estate, staples, and utilities -- all clustered around 0% for the week.
As we end the week, an argument can be made that this rally might be getting some legs. Let's start with the weekly charts:
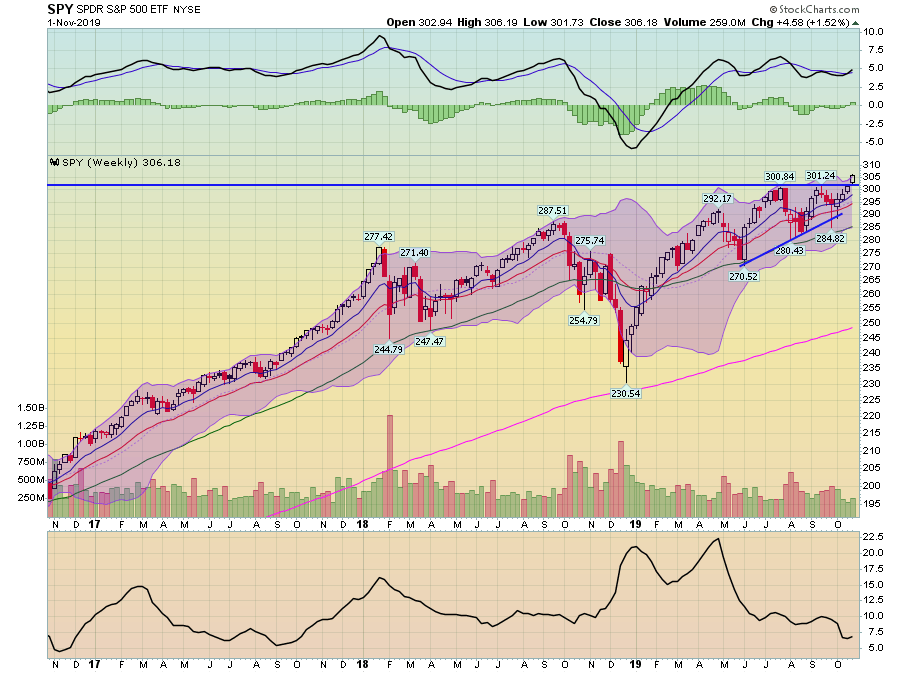
The SPY is at a high, having moved through resistance in the lower 300s.
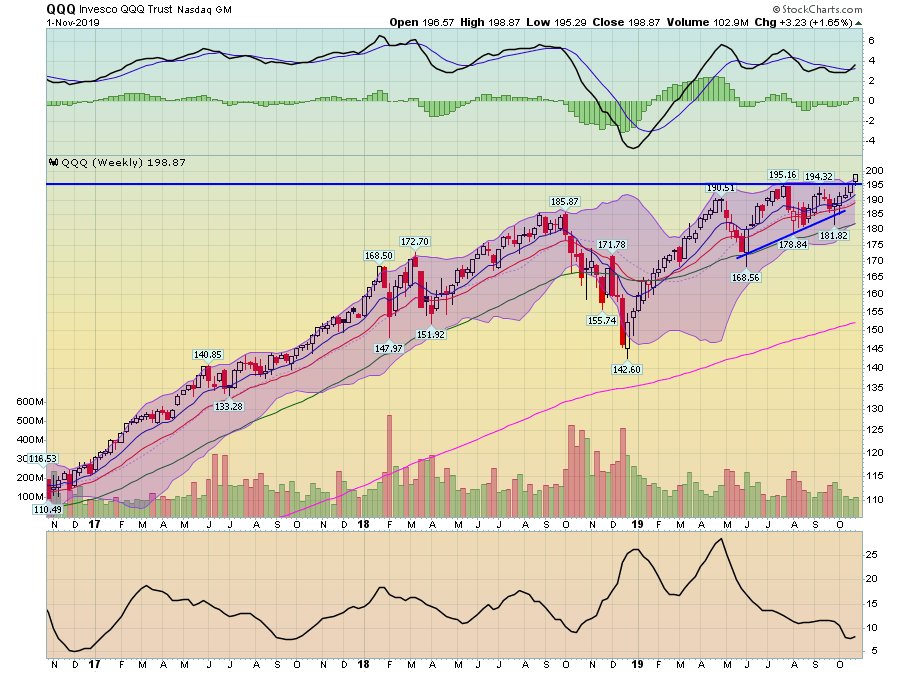
The QQQ also broke through resistance as well and is at a 5-year high.
And the small-caps indexes all had solid weeks.
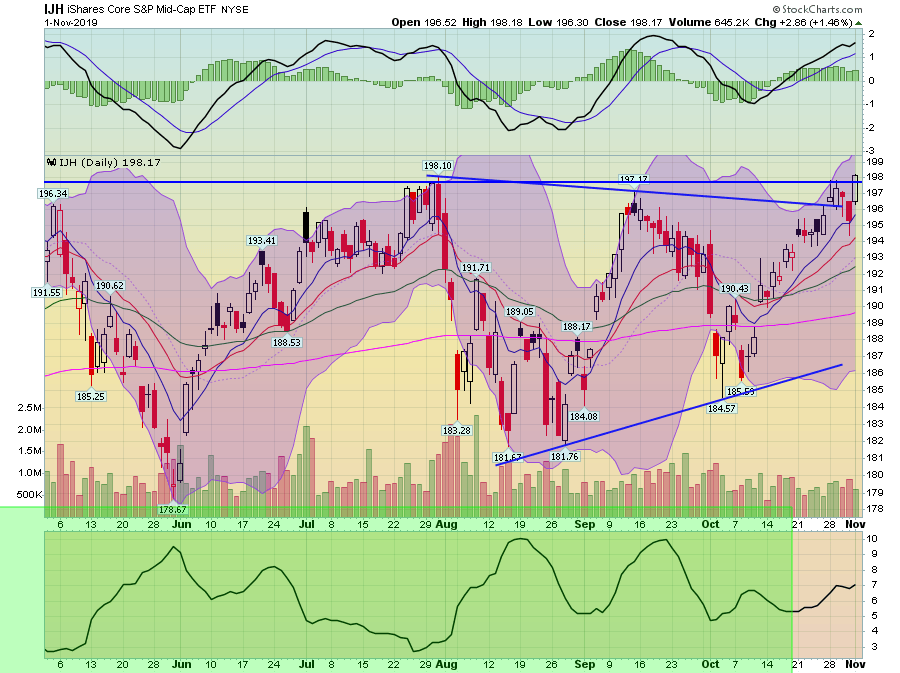
The IJH broke through resistance and is at a 6-month high.
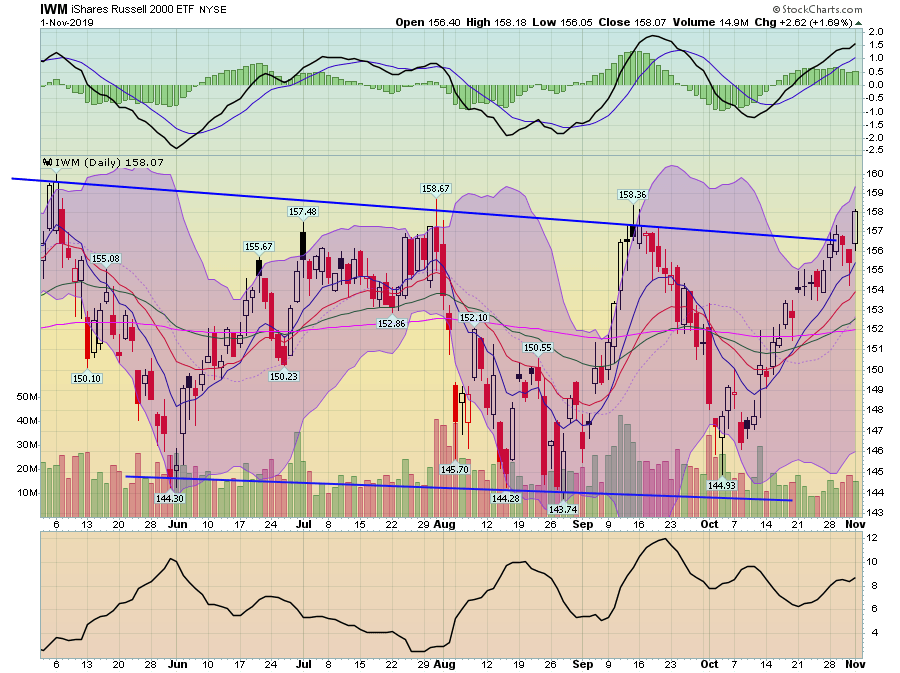
Today, the IWM printed a very strong bar as it moved through resistance.
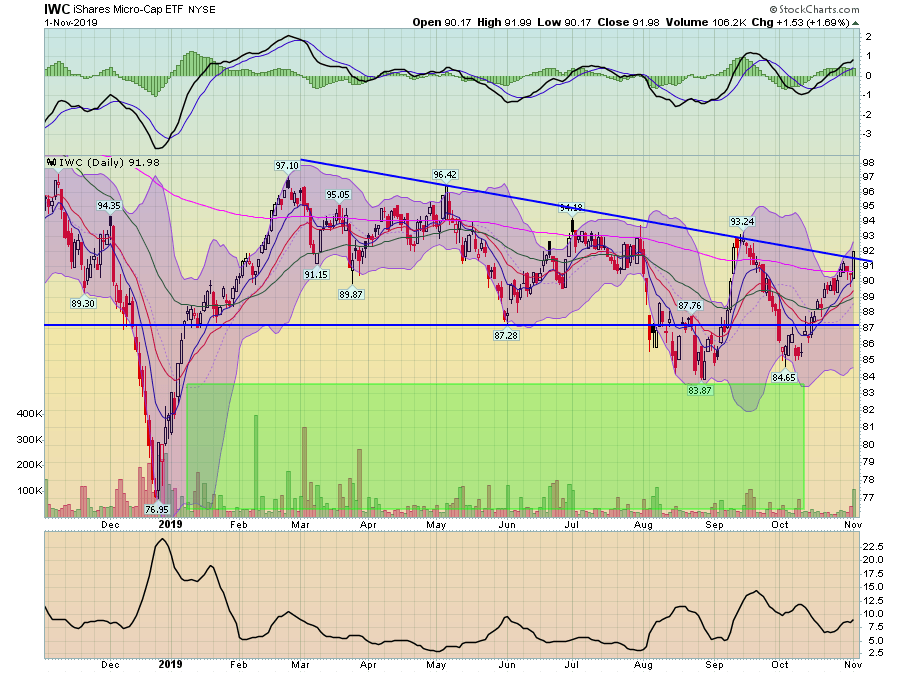
And the IWC printed its strongest bar in over a month as it moved through resistance.
The short version is the markets are happy with things right now and closed the week on a high note. Let's end it there.
