Summary
- The Conference Board's Leading and Coincidental indexes are soft.
Let's take a look at the industrial sector starting with Fed's regional manufacturing indexes:
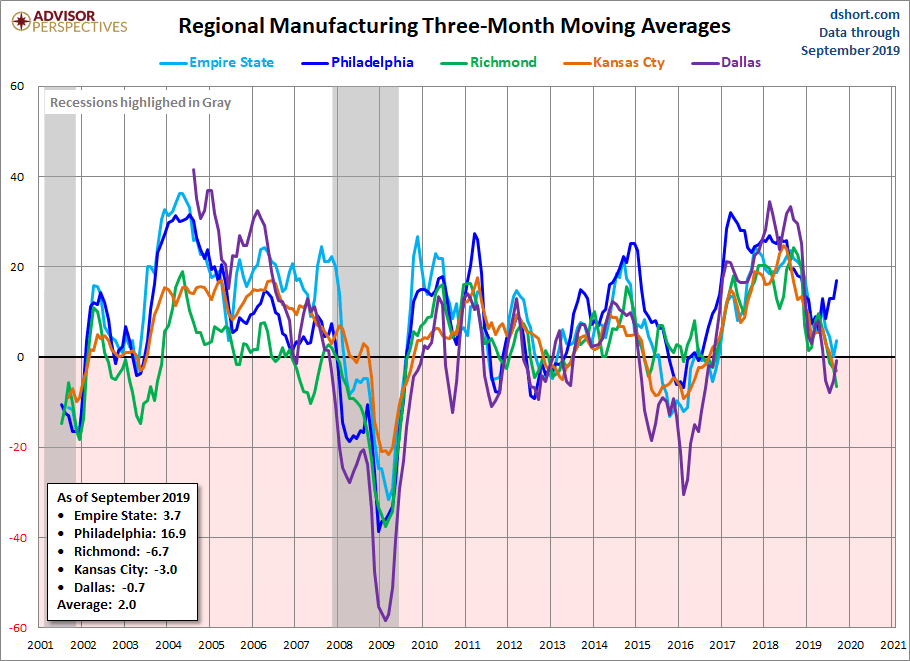
All have been declining this year except the Philly Fed index (in blue). Most have recently risen, although a majority are still near 0. The declines in these surveys not only explains the contracting ISM data, but also the softness in industrial production. This also explains durable goods manufacturing data, where the headline number has declined sharply in five of the last 12 months and the number ex-transportation has trended sideways for most of this year. All this data goes a long way to explaining the modest trend in the XLI:
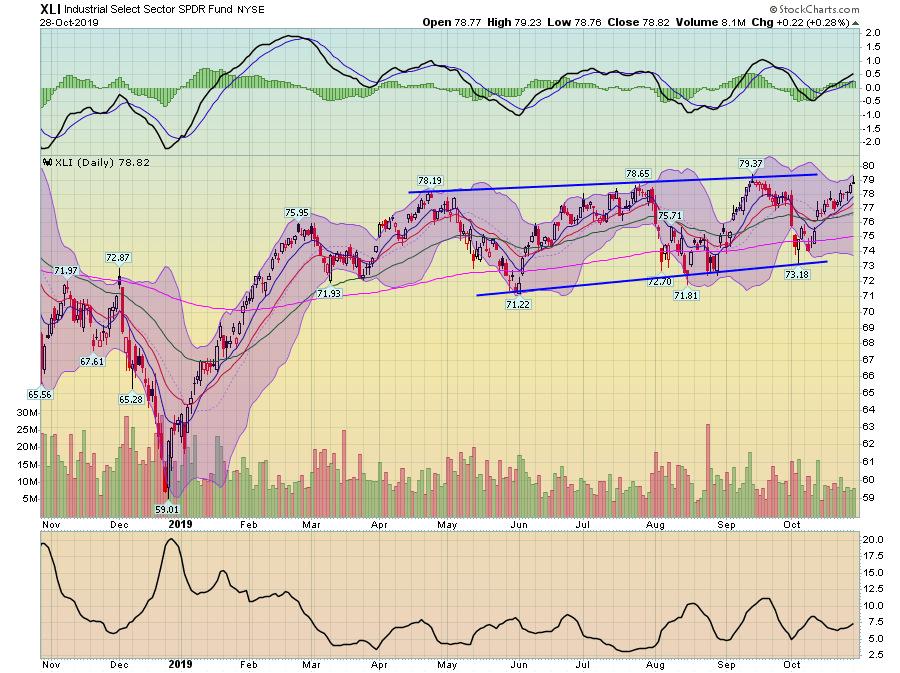
The XLI is moving higher but at a very slight rate. Three times in the last five months the ETF has traded right below the 200-day EMA -- a potentially negative bearish development.
The leading indicators are modestly negative:
“The US LEI declined in September because of weaknesses in the manufacturing sector and the interest rate spread which were only partially offset by rising stock prices and a positive contribution from the Leading Credit Index,” said Ataman Ozyildirim, Senior Director of Economic Research at The Conference Board. “The LEI reflects uncertainty in the outlook and falling business expectations, brought on by the downturn in the industrial sector and trade disputes. Looking ahead, the LEI is consistent with an economy that is still growing, albeit more slowly, through the end of the year and into 2020.”
Here's a table from the report to flesh out the data:
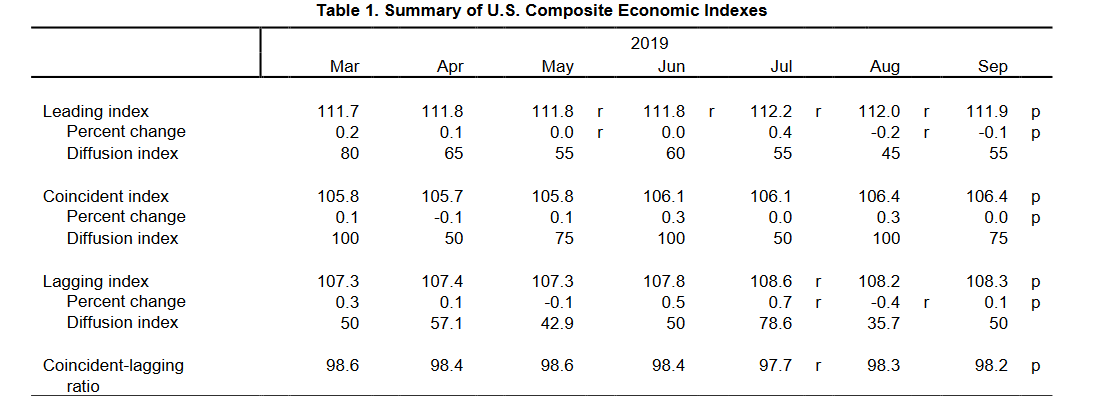
Both the leading and coincidental indexes are weak: the LEIs have declined the last two months while the CEIs have been flat in two of the last three months. Over the last six months, both data sets have been weak. This explains why the NY Fed's GDP Nowcast for 3Q GDP is 1.9% while the Atlanta Fed's is 1.7%.
The Fed has a three-way split right now. The majority voted to cut rates at the last meeting. But there were two (Rosengren and George) who argued for no cuts. These two could point to low unemployment and steady prices to support their argument. St. Louis President Bullard argued for a 50 basis point cut. He's been very concerned about low inflation for a number of years and used that to support his argument for a stronger cut. Finally, remember that the last cut was mostly proscriptive (emphasis added):
... the Committee decided to lower the target range for the federal funds rate to 1-3/4 to 2 percent. This action supports the Committee's view that sustained expansion of economic activity, strong labor market conditions, and inflation near the Committee's symmetric 2 percent objective are the most likely outcomes,but uncertainties about this outlook remain.
While the US data has been softer, there's only a remote chance of a recession in the next 6-12 months, which makes the argument for another rate cut very hard to make.
Let's look at today's performance tables:
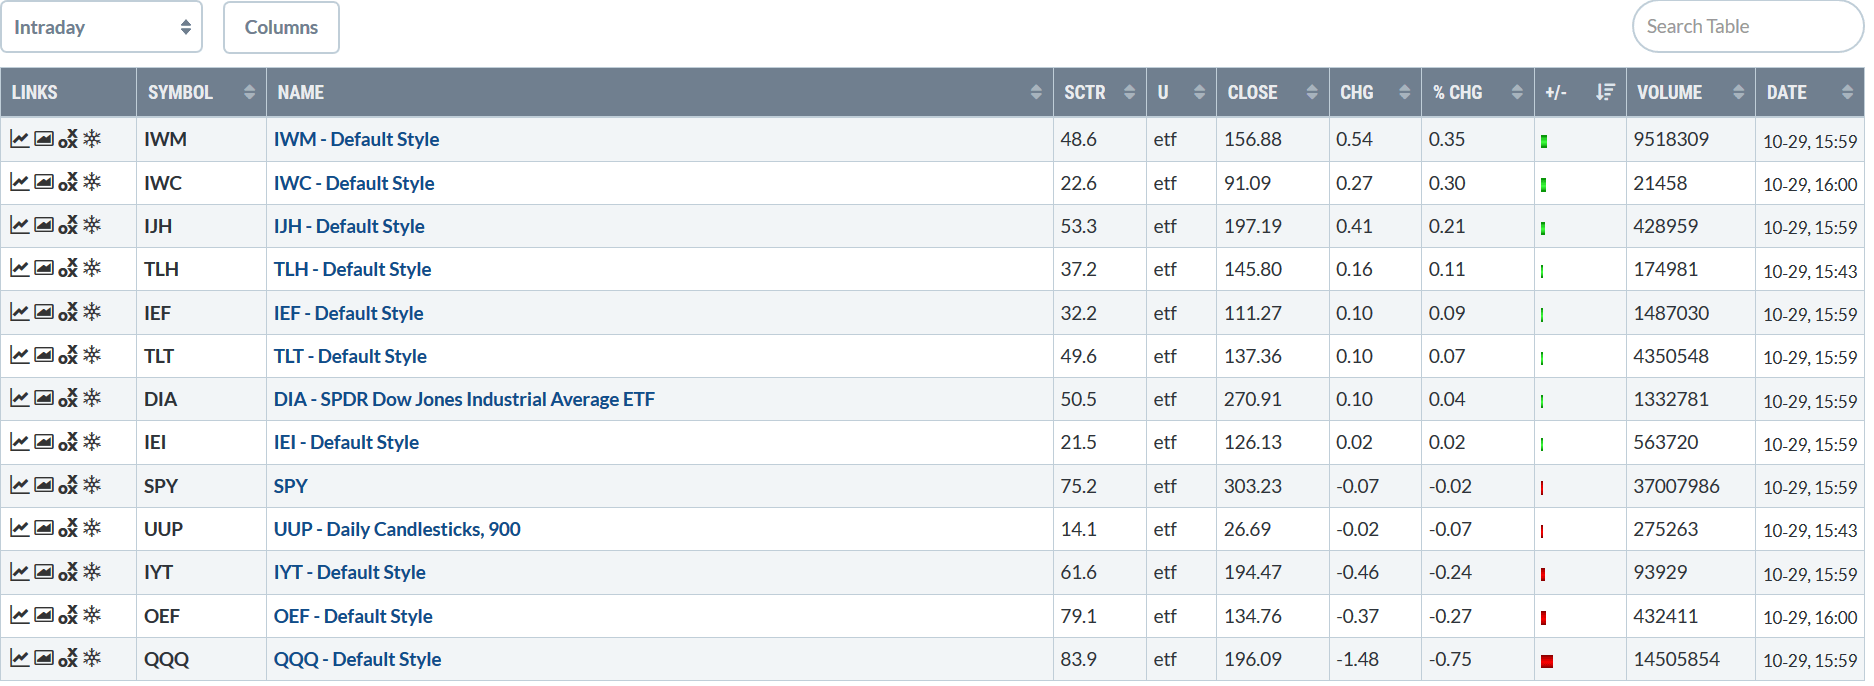
Definitely an odd day for the market. The small-caps were the "best" performers. But were up slightly better than marginally. The larger caps were right around 0% while the QQQ was off 0.75%. There's not much reason to the above tables.

The sector performance is also mixed. Healthcare got a boost from strong earnings news. After its 1.445% gain, performance tapers off; the XLB was the second-best performer, rising 0.63% and energy gained 0.42%. At the other end are technology and consumer discretionary, the day's laggards. Like the table for the major indexes, this one doesn't have much order or logic to it.
Turning to the charts, let's start with the SPY and QQQ:
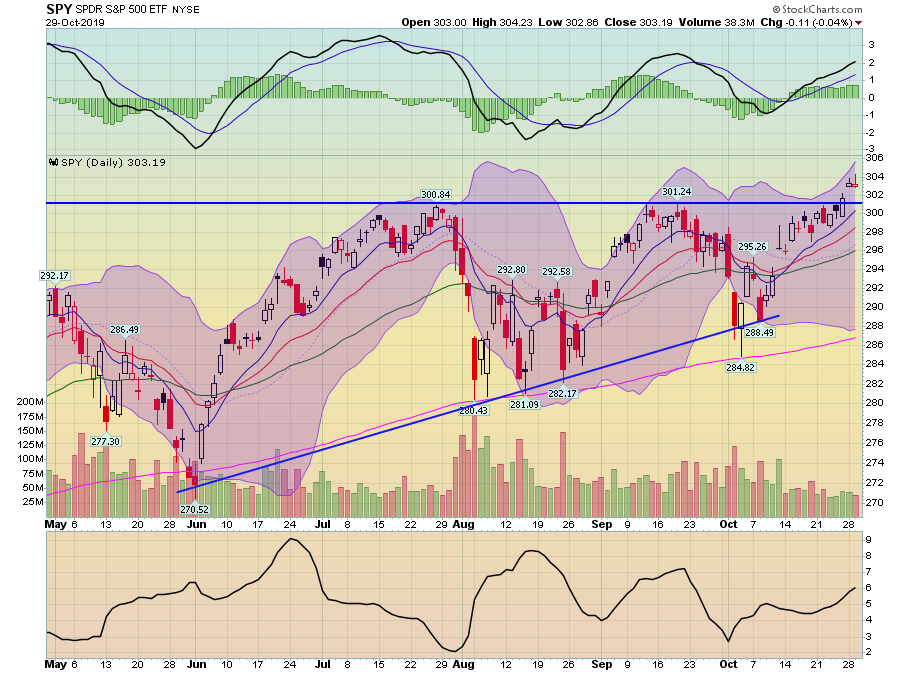
The {{0|SPY})} chart has printed two very small candles over the last two days, indicating very little difference between the opening and closing prices. On both days, prices were higher at some point during the day. It's easy to read too much into individual candles. However, the lack of a post-breakout candle with a really big body means there's a lack of momentum. That could all change with the Fed meeting -- or a positive trade talk announcement. But for now, it means the market is biding its time.
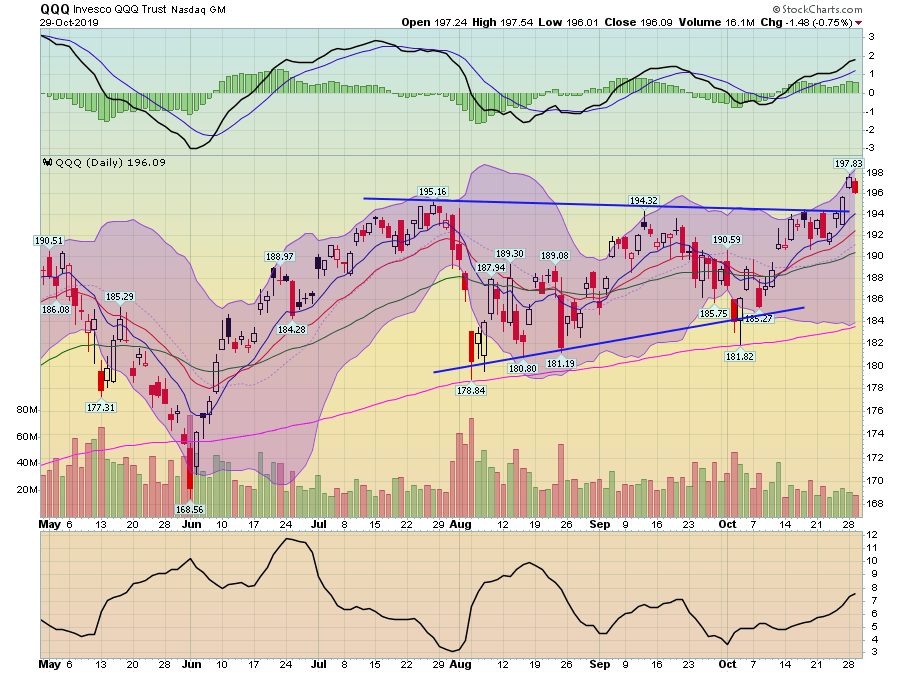
And then there's the QQQ chart, which was down today. Again -- don't read too much into the chart. But don't dismiss it, either.
On the plus side, the smaller-cap indexes are printing some bigger candles:
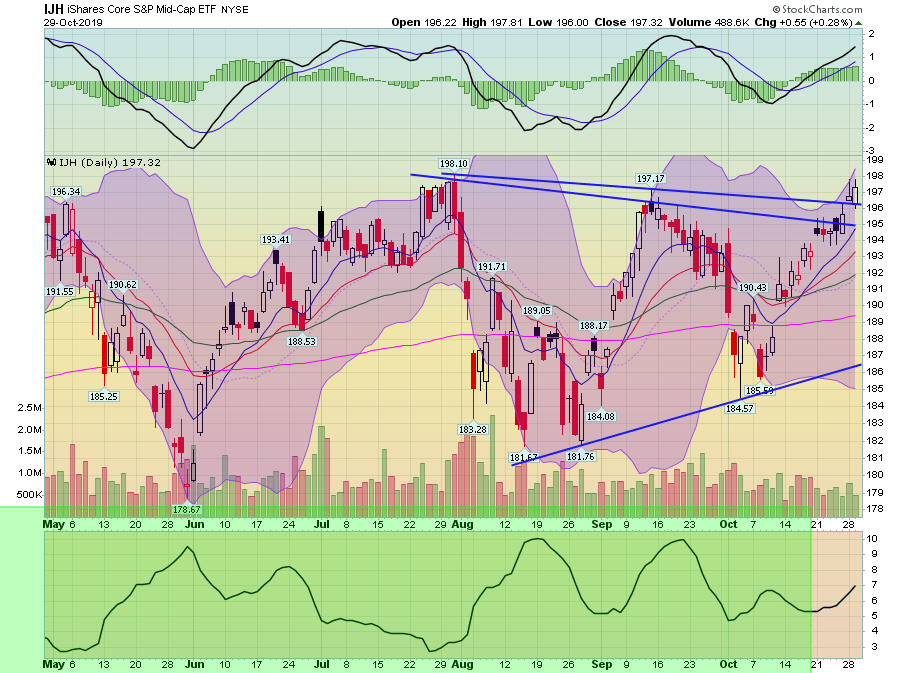
The IJH did print a larger bar ...
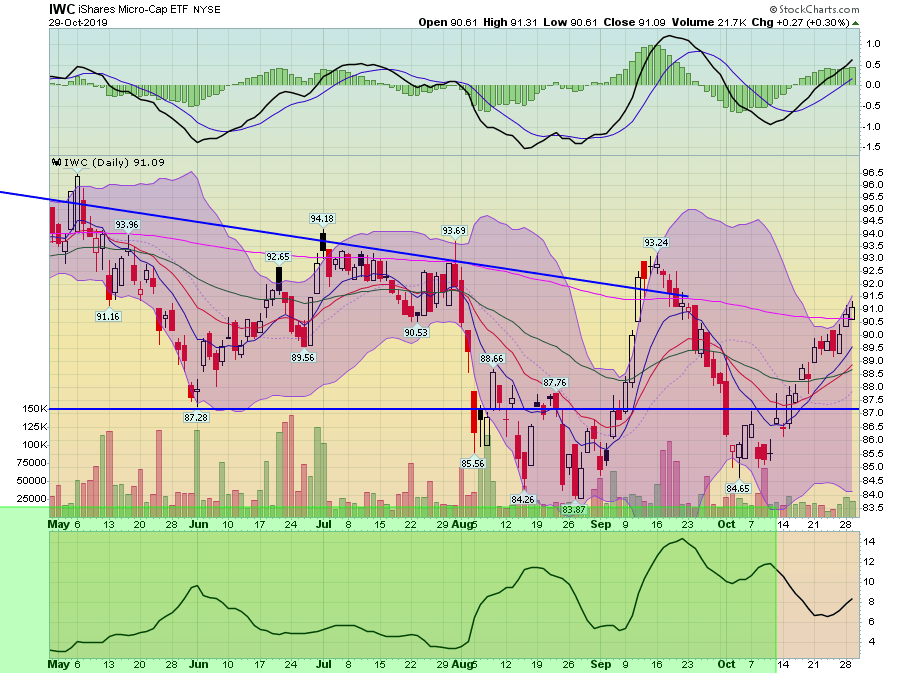
... as did the IWC, which also rose above its 200-day EMA.
Ultimately, what we're probably seeing is the markets waiting for the Fed to issue its latest pronouncement.
