The volatility index, VIX, has remained very low since the presidential election. Even the over 1% sell-off did not cause much a spike in VIX yesterday. Not only has the VIX been hovering around 11, the index even had a flash crash to a 9-handle in reacting to the FOMC statement on February 1, 2017. We are often asked whether volatility is coming back. On our way to an answer, we should first clarify some common misconceptions about the volatility index.
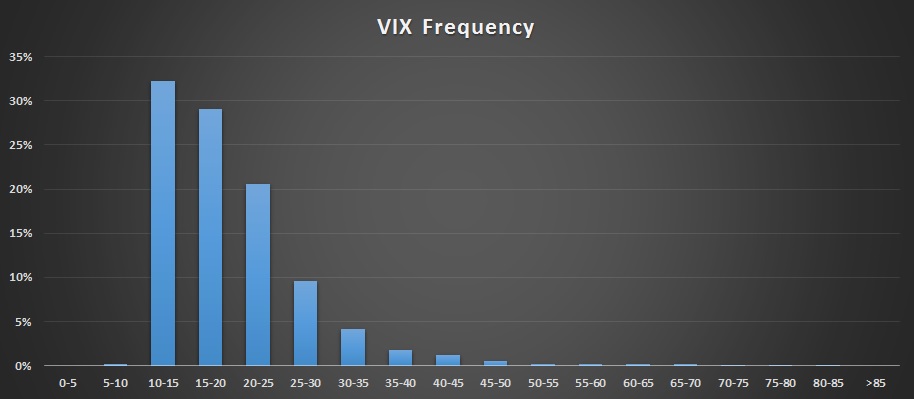
You may have heard traders betting on VIX to bounce back because its level is so low. Unfortunately, those who took the trade have probably ended up with some losses. The reason is actually quite simple: the distribution of the VIX index is not normal. As a matter of fact, VIX is highly skewed towards the low end, as shown in Figure 1.

Historically, VIX has stayed below 15 one-third of the time and remained below 20 about 60% of the time. Clearly, this is not a bell-curve distribution that follows normal probability theory. Put differently, the index tends to be in the lower end of its distribution and may stay there for an extended period, against investors’ wishes for a near-term rebound. This makes timing the VIX potentially even more difficult than timing the stock market.
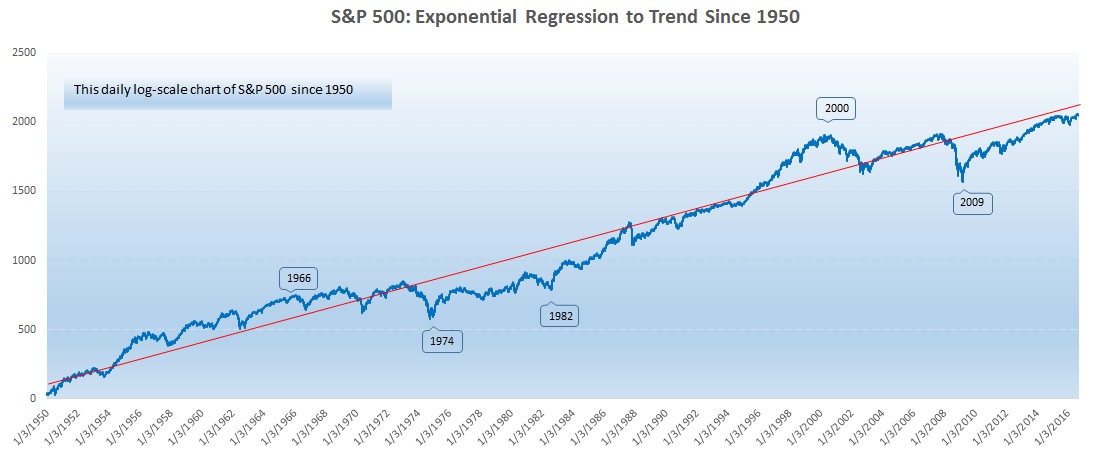
As history has observed, the stock market follows a mean-reversion process, as demonstrated in Figure 2: Equities increase in the long run, with short-term fluctuations. The mean, even though it increases through time, can be approximated as the trend line indicated below.

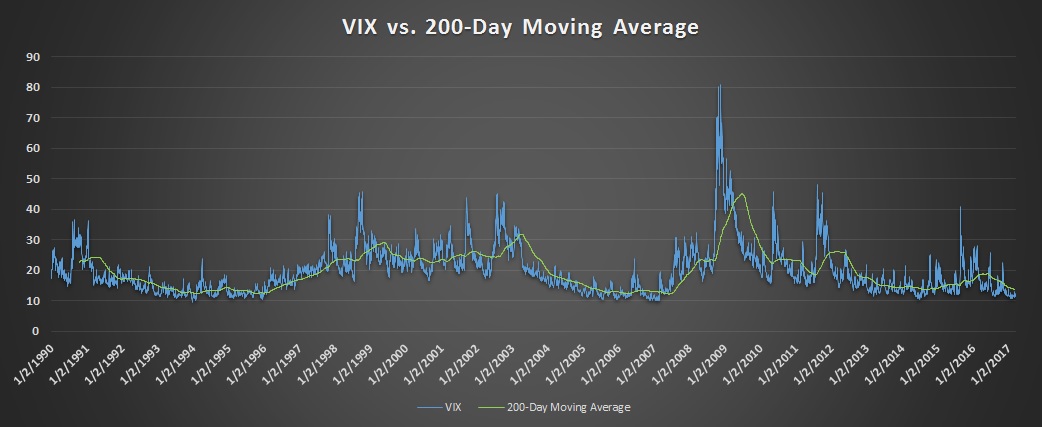
However, VIX does not follow the same type of mean-reversion process. From the VIX history below we can see that it is not an upward-trending index. More importantly, the rises and falls in VIX are caused mainly by market events and conditions. Since those events are mostly random, VIX is unlikely to follow any pattern. But we can still employ some technical analysis, such as using the moving average as a summary tool, to identify trends in VIX. However, please be aware that technical analysis is designed to summarize past information but does not necessarily provide any forecasting power.
In addition, VIX moves violently in response to market shocks. Any average of VIX that incorporates data from a prolonged uneventful period is fated to deliver misguided information. Thus, betting on VIX on the basis of a mean-reversion argument is not likely to provide the biggest bang for your buck.

Another common misconception is that VIX represents the level of complacency in the market. Undoubtedly, VIX has been widely accepted as the “fear gauge.” While a high VIX indicates mounting fear, what does a low VIX mean? This brings us to the method of calculating VIX.
VIX uses both puts and calls (out-of-money options) to reach an averaged expected volatility in the next 30 days. However, an often-ignored key factor is that VIX uses forward price rather than spot price to calculate variance. This suggests that if the market expected a regime change in the future, a shift in VIX could happen. Therefore, an absolute level of VIX may not be as indicative as the change in VIX. In our opinion, the opposite of fear is not necessarily complacency in the case of VIX. Just because the market is not fearful does not mean the market is complacent.
While most would likely agree that VIX is not going to go much lower from here, we would caution investors on gambling on a quick turnaround, since, as you may have observed, the volatility index itself can be very volatile. For those equity investors who follow the VIX closely as a market indicator, please keep in mind that the stock market can go up and down in both high- and low-VIX environments.
