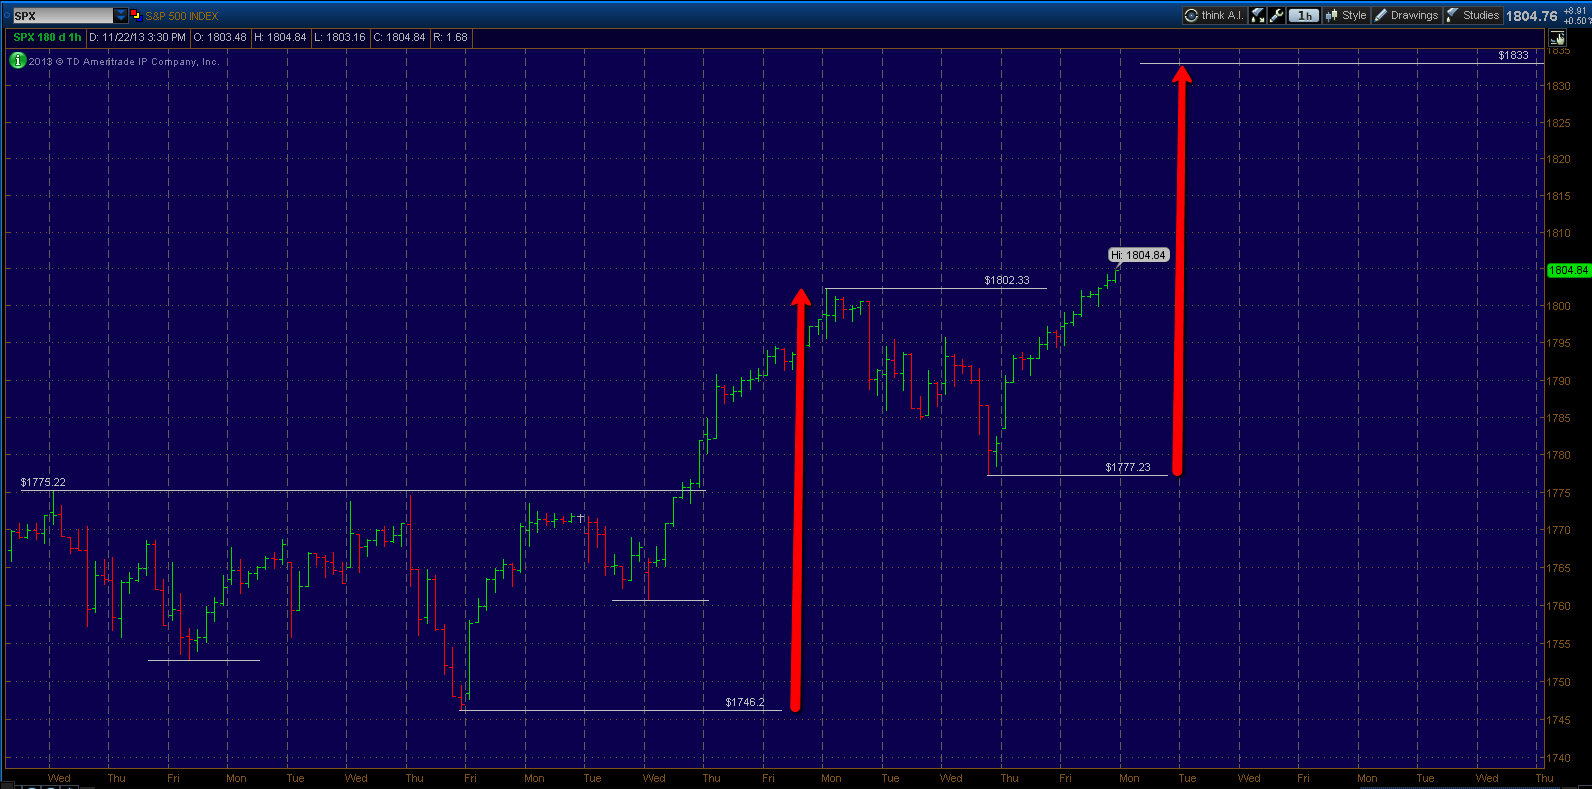
The S+P 500 and the Dow both closed the week at new all time highs. 1775 in the S+P 500 was key and it reacted very well. The next measured move upside target will now take the S+P 500 up to 1833 in the near term. In the long term I still maintain the market is getting quite overextended but another 3-4% upside is realistic.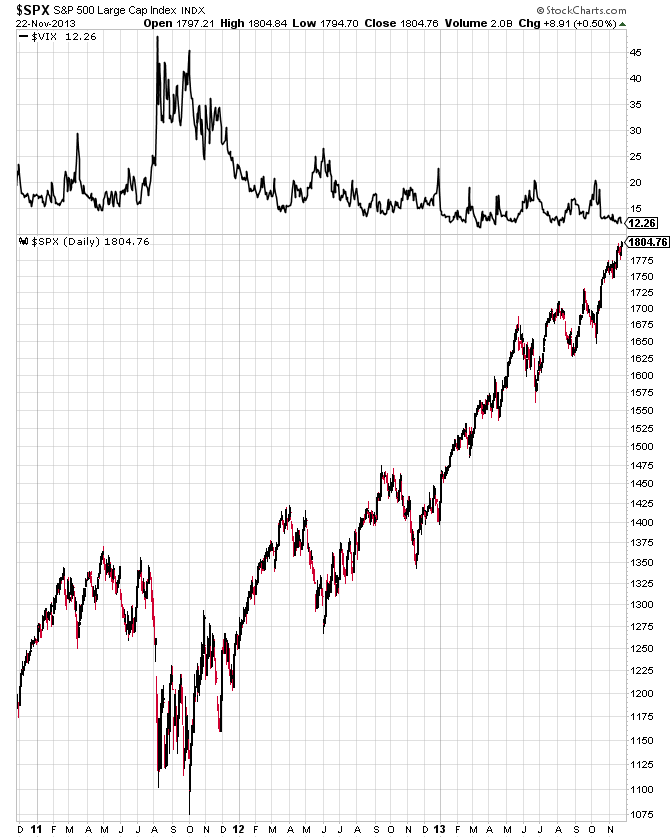
The Volatility Index (VIX) remains very low, each time this year that the VIX hit 20 it became a reliable buy signal. A VIX below 20 generally suggests that pullbacks are short lived and shallow, more of the 4-5% variety, which is what we have seen.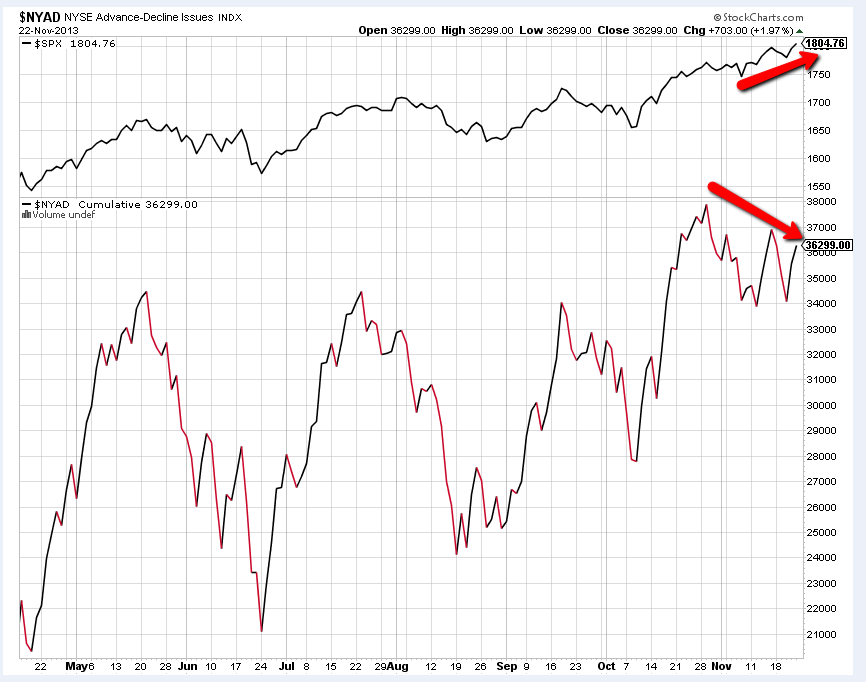
The cumulative advance - decline line continues to show bearish divergences. This indicator has not moved much higher since the May highs meanwhile the S+P 500 is roughly 6% higher above it's May high. This means the advance has been occurring with fewer participants and is usually a precursor to a significant correction. However this is not a timing tool and these divergences to go on for awhile before it eventually settles itself out.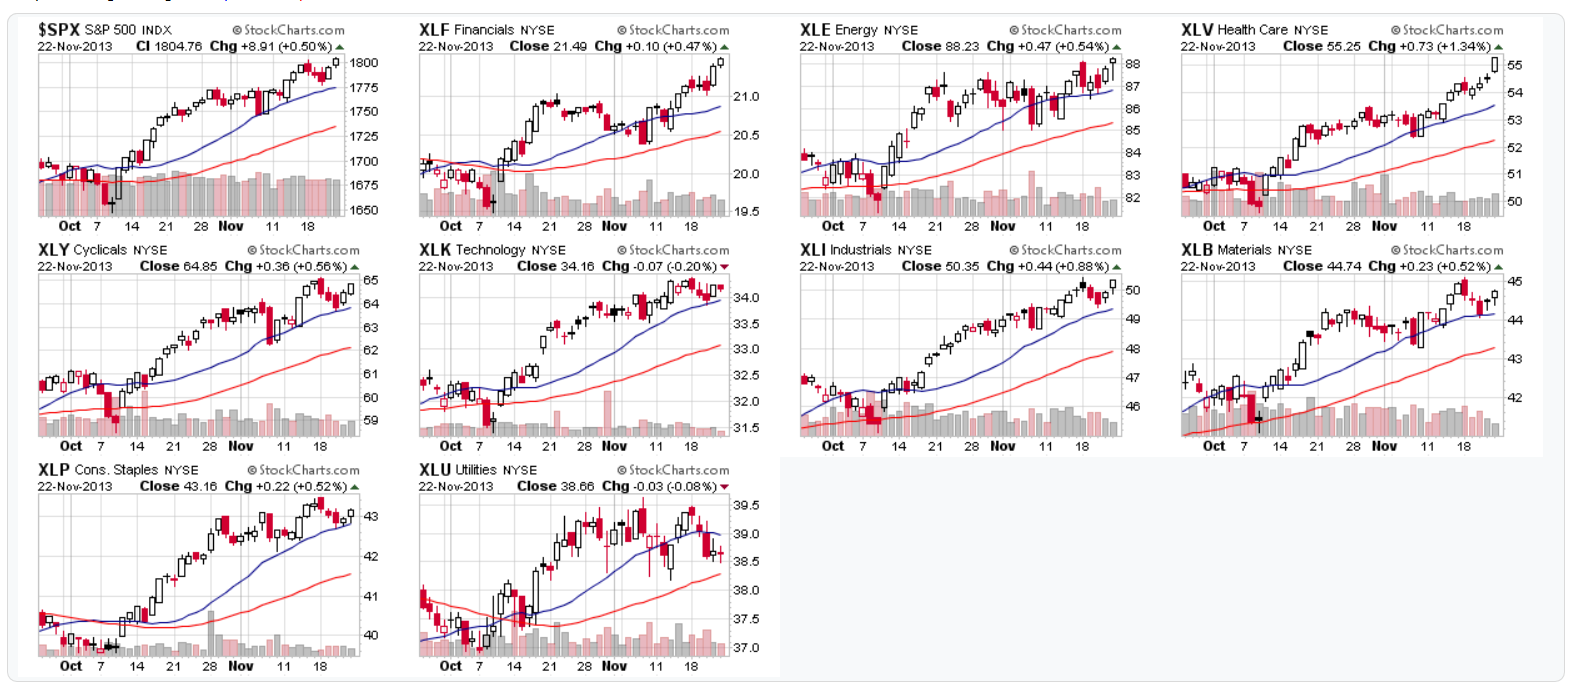
Three of the nine sectors within the S+P 500 also made new highs on the year. Those being Financials, Energy and Health Care.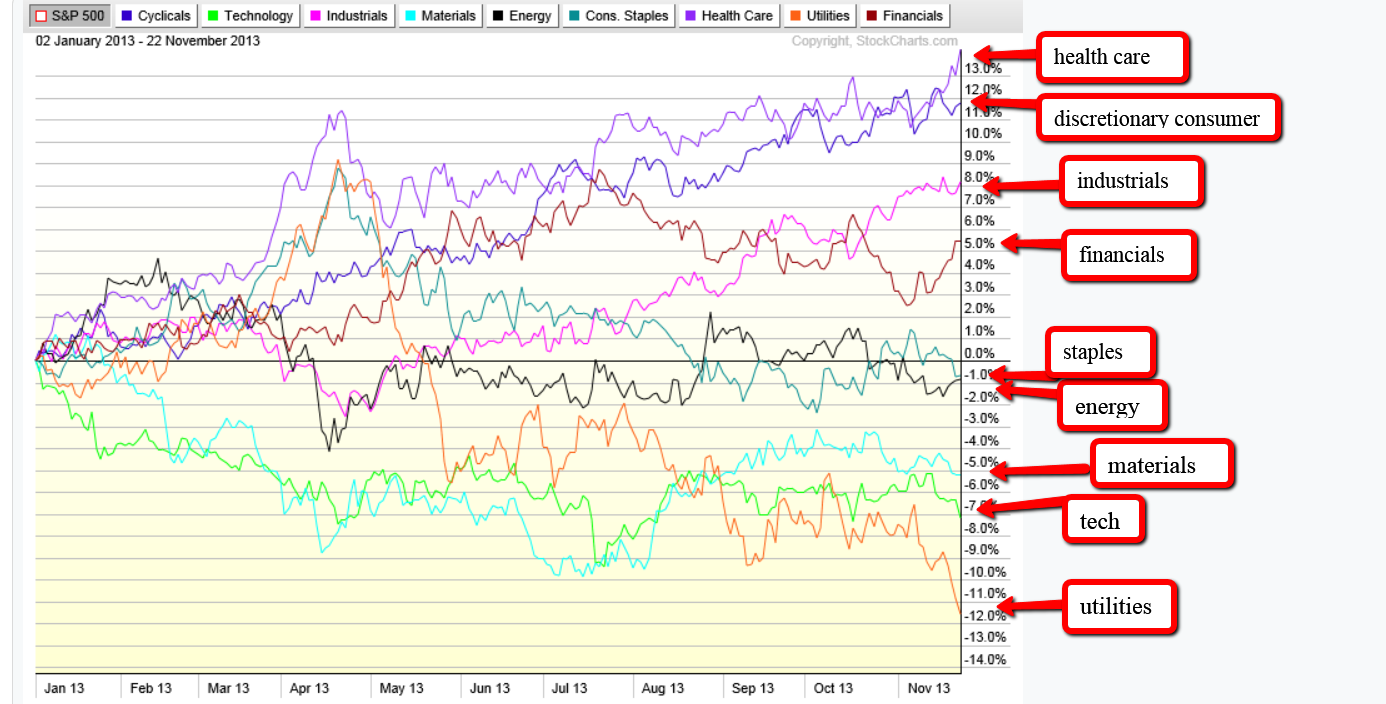
Year to date relative strength in this market comes from Health Care, Discretionary, Industrials and Financials. Underperformance comes from Materials, Tech and Utilities.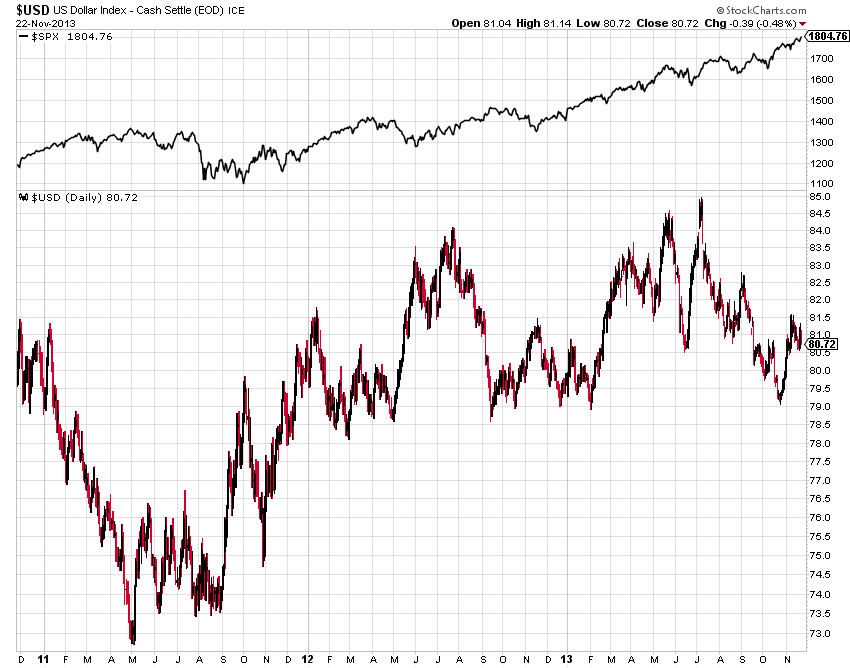
The US Dollar continues to find support around the $79 level, it's year to date performance has been roughly flat. I am watching the lows at $79 going forward, as the last time we had a significant drop in the Dollar, it eventually put downward pressure on equities in 2011. 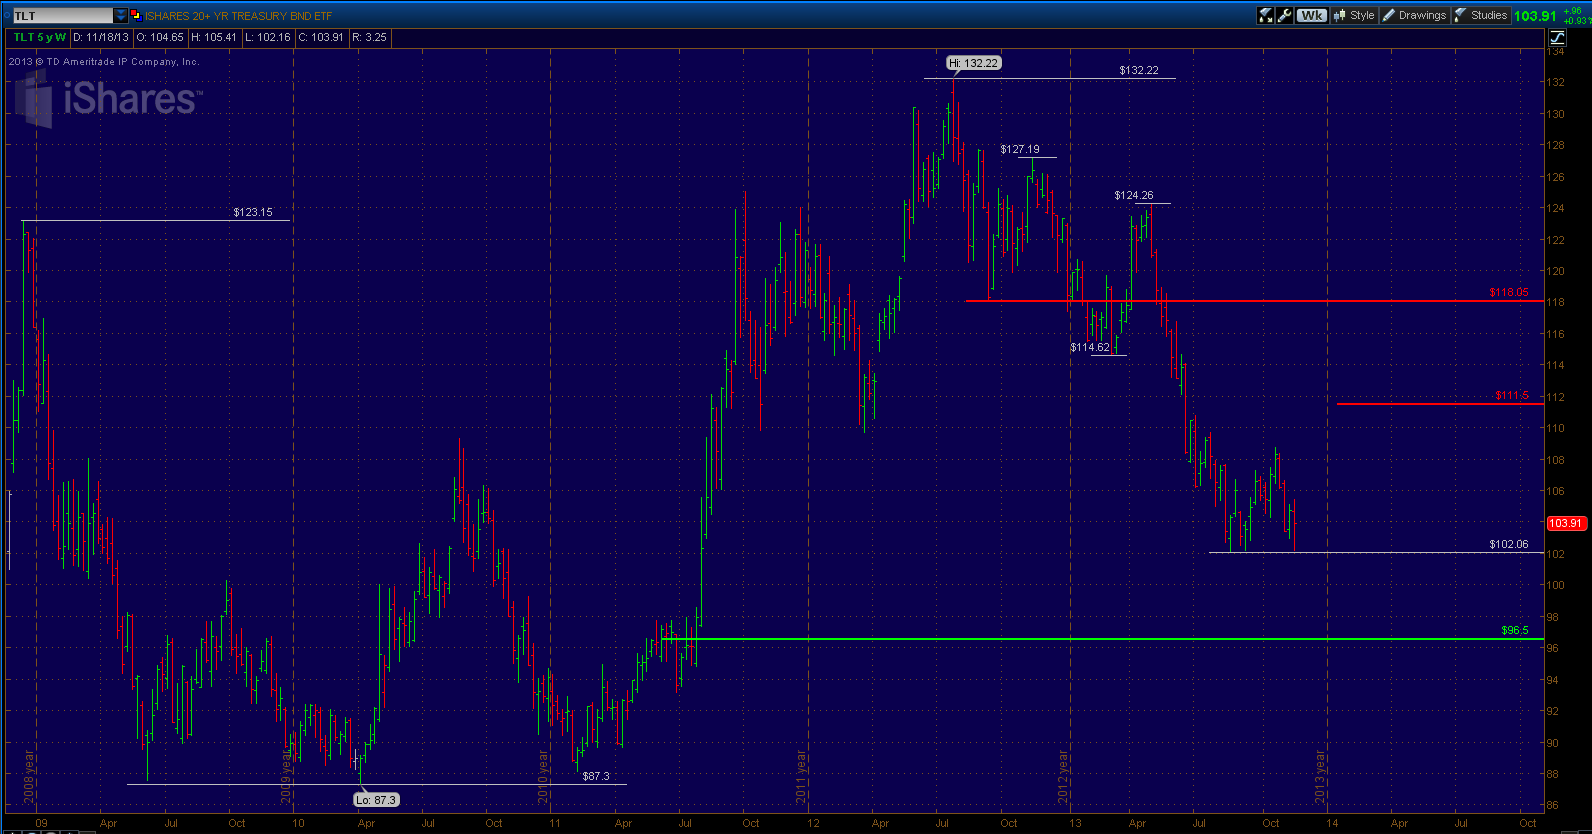
TLT (Bonds) found support again at $102 this week. Upside resistance now stands at $111.50 and $118 as denoted on the chart. Next support level below comes in around $96-$97. At that point it would about match the size of the drop during the 2009-2010 correction, which happened to be the biggest correction seen since TLT was introduced.
TLT would need to find support there or $87 will eventually get taken out afterwards.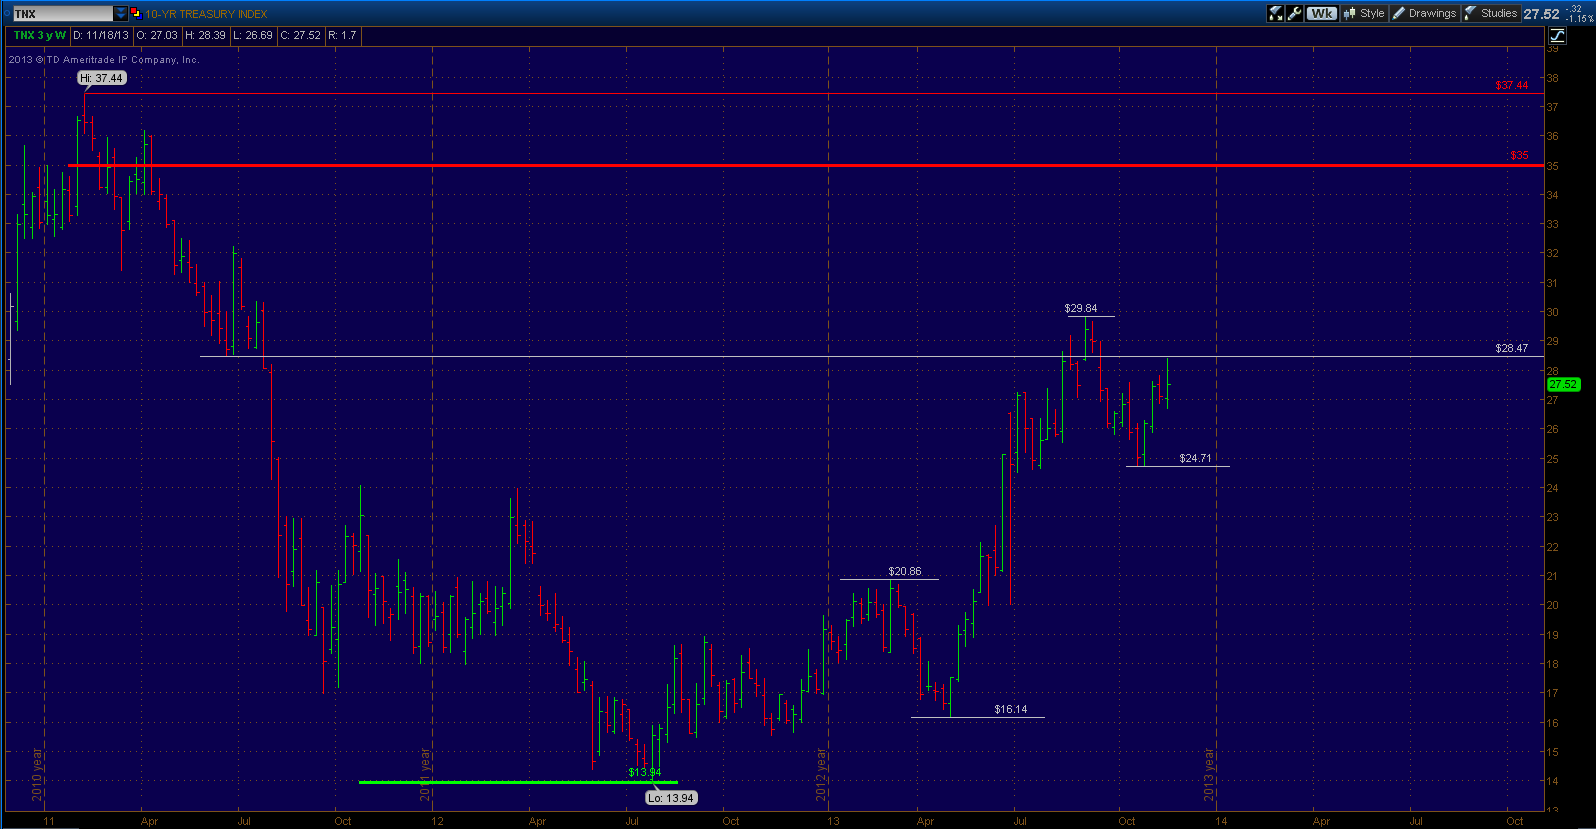
The yield on the ten year continues to hold above 2.5% after nearing the 3% area. It has completed a correction about the size of the one that took place early this year. The next upside comes in at 3.35% and downside support stands at 2.25%.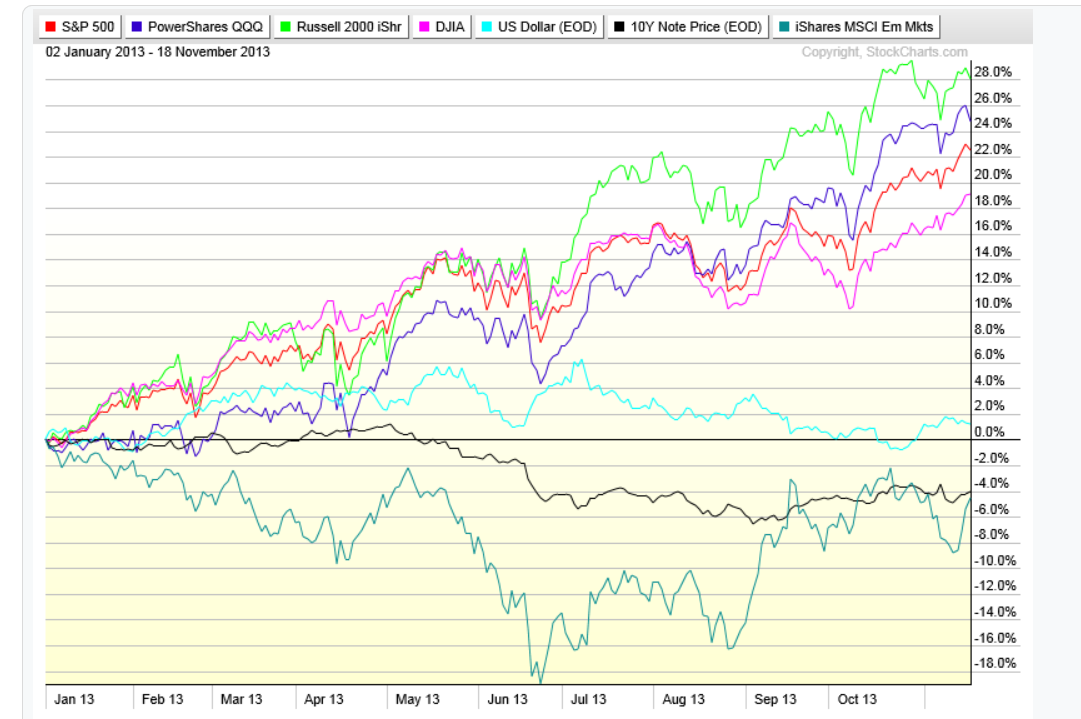
In conclusion, a look at year to date performance among asset classes. Obviously it's been a tremendous year for equities with Small Caps and Large Cap Tech leading the way with above 24% returns. Emerging markets are the laggards, with growth and "Taper" worries weighing heavily.
- English (UK)
- English (India)
- English (Canada)
- English (Australia)
- English (South Africa)
- English (Philippines)
- English (Nigeria)
- Deutsch
- Español (España)
- Español (México)
- Français
- Italiano
- Nederlands
- Português (Portugal)
- Polski
- Português (Brasil)
- Русский
- Türkçe
- العربية
- Ελληνικά
- Svenska
- Suomi
- עברית
- 日本語
- 한국어
- 简体中文
- 繁體中文
- Bahasa Indonesia
- Bahasa Melayu
- ไทย
- Tiếng Việt
- हिंदी
Market Summary: Dow Ends Week Above 16,000, S&P 500 Above 1800
Published 11/23/2013, 12:30 PM
Updated 07/09/2023, 06:31 AM
Market Summary: Dow Ends Week Above 16,000, S&P 500 Above 1800
Latest comments
Loading next article…
Install Our App
Risk Disclosure: Trading in financial instruments and/or cryptocurrencies involves high risks including the risk of losing some, or all, of your investment amount, and may not be suitable for all investors. Prices of cryptocurrencies are extremely volatile and may be affected by external factors such as financial, regulatory or political events. Trading on margin increases the financial risks.
Before deciding to trade in financial instrument or cryptocurrencies you should be fully informed of the risks and costs associated with trading the financial markets, carefully consider your investment objectives, level of experience, and risk appetite, and seek professional advice where needed.
Fusion Media would like to remind you that the data contained in this website is not necessarily real-time nor accurate. The data and prices on the website are not necessarily provided by any market or exchange, but may be provided by market makers, and so prices may not be accurate and may differ from the actual price at any given market, meaning prices are indicative and not appropriate for trading purposes. Fusion Media and any provider of the data contained in this website will not accept liability for any loss or damage as a result of your trading, or your reliance on the information contained within this website.
It is prohibited to use, store, reproduce, display, modify, transmit or distribute the data contained in this website without the explicit prior written permission of Fusion Media and/or the data provider. All intellectual property rights are reserved by the providers and/or the exchange providing the data contained in this website.
Fusion Media may be compensated by the advertisers that appear on the website, based on your interaction with the advertisements or advertisers.
© 2007-2025 - Fusion Media Limited. All Rights Reserved.
