Market Snapshot:
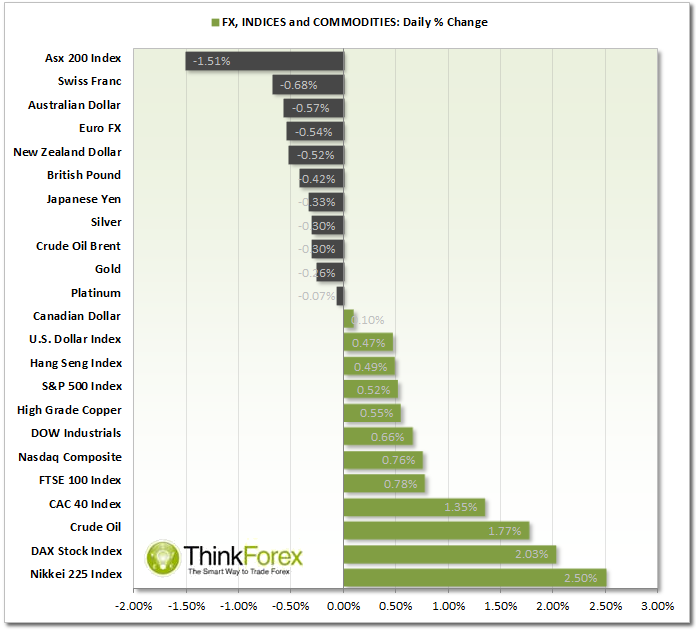
ECONOMY: Christine Laggard, MD of the international Monetary Fund, voiced her concerns of the global economy being at risk of deflation "with inflation running below many central banks' targets...". The Eurozone in particualr is at a higher risk, which may see falling prices similar to Japan's over the past 20 years.
INDICES: European Indices take the lead with DAX and Euro Stoxx 50 breaking to record new highs. FTSE100 is very close to approsching the 2007 highs which provides real-time barometer of risk sentiment for EUR and GBP single currencies.
AUD: Selling off across the board after shedding 30k jobs in December. The weakest single currency this week, and printed fresh new lows against the Kiwi.
CAD: Continues to retrace from recent losses but trend remains bearish.
COMMODITIES: Gold remained above the 1237 support zone awaiting the next catalyst. WTI and Brent continue to retreat from their weekly lows and similar to CAD, the trends remain bearish and this is a suspected bullish correction. US is unlikely to remove the ban on Crude exports
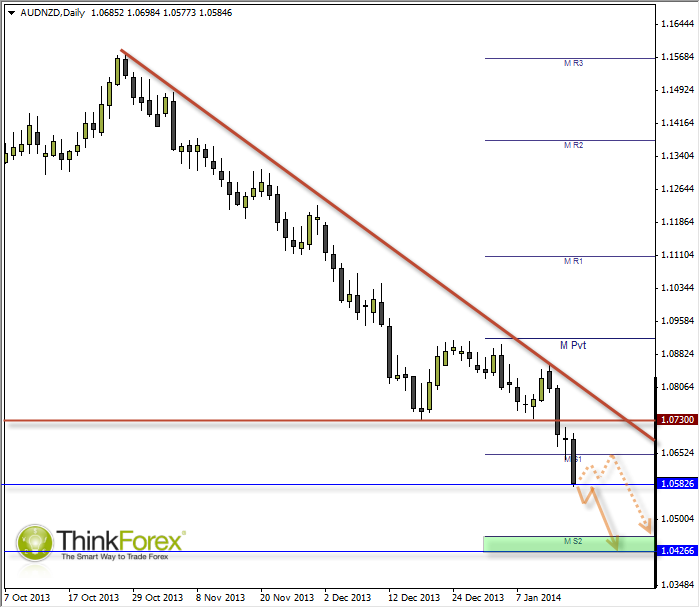
AUD/NZD: Targeting 1.042-5
Currently trading at 5-year lows and resting upon the 2008 low AUD/NZD looks increasingly fragile to say the least. Not only do we continue to print new lows but we are also increasing the bearish momentum.
After today's disappointing jobs figures earlier today we then broke below the Monthly S1 which could make a likely resistance level in the event of any retracement.
Without any clear levels to choose from in regards to support/resistance I have used a combination of the 2005 and Monthly S2 to provide our target zone.
 AUD/NZD Daily" border="0" height="608" width="700">
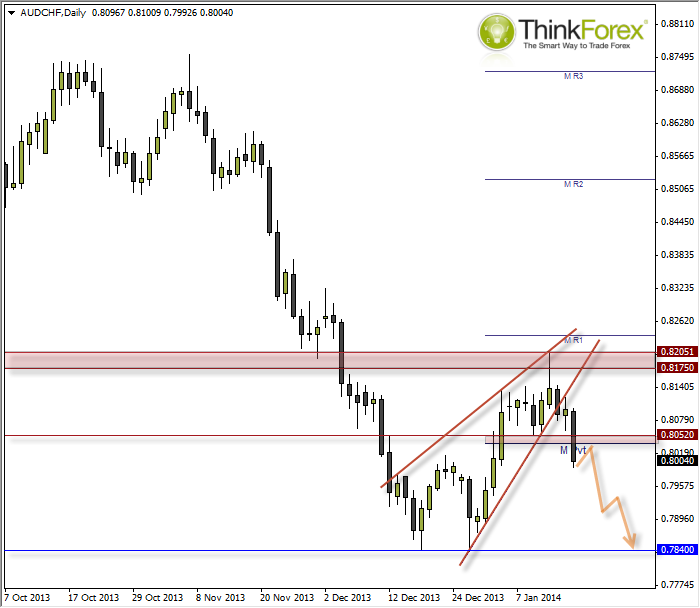
AUD/CHF: Targeting 0.785
A rising Wedge formation (bearish) has been confirmed by breaking out of the lower trendline. What I like about this particular pattern is how the tip of the wedge has a Shooting-Star Reversal at the highest point, where the upper wick tested (but failed) to break above the resistance zone around 0.817-0.820. This pattern projects a target around the base of the wedge at 0.784 so my strategy is to trade in line with the dominant bearish trend, targeting the base of the wedge and trading on the lower timeframes using candles to enter.
Price has found support at the Daily S3 pivot (not shows) which is why I suspect a retracement before a resumption of losses.
Ideally I want to see bearish signals appear around the resistance zone comprising of the monthly pivot and the pivotal S/R level.
 AUD/CHF" border="0" height="608" width="700">
- English (UK)
- English (India)
- English (Canada)
- English (Australia)
- English (South Africa)
- English (Philippines)
- English (Nigeria)
- Deutsch
- Español (España)
- Español (México)
- Français
- Italiano
- Nederlands
- Português (Portugal)
- Polski
- Português (Brasil)
- Русский
- Türkçe
- العربية
- Ελληνικά
- Svenska
- Suomi
- עברית
- 日本語
- 한국어
- 简体中文
- 繁體中文
- Bahasa Indonesia
- Bahasa Melayu
- ไทย
- Tiếng Việt
- हिंदी
Market Snapshot: European Indices Take The Lead
Published 01/16/2014, 06:12 AM
Updated 08/22/2024, 06:01 PM
Market Snapshot: European Indices Take The Lead
Latest comments
Loading next article…
Install Our App
Risk Disclosure: Trading in financial instruments and/or cryptocurrencies involves high risks including the risk of losing some, or all, of your investment amount, and may not be suitable for all investors. Prices of cryptocurrencies are extremely volatile and may be affected by external factors such as financial, regulatory or political events. Trading on margin increases the financial risks.
Before deciding to trade in financial instrument or cryptocurrencies you should be fully informed of the risks and costs associated with trading the financial markets, carefully consider your investment objectives, level of experience, and risk appetite, and seek professional advice where needed.
Fusion Media would like to remind you that the data contained in this website is not necessarily real-time nor accurate. The data and prices on the website are not necessarily provided by any market or exchange, but may be provided by market makers, and so prices may not be accurate and may differ from the actual price at any given market, meaning prices are indicative and not appropriate for trading purposes. Fusion Media and any provider of the data contained in this website will not accept liability for any loss or damage as a result of your trading, or your reliance on the information contained within this website.
It is prohibited to use, store, reproduce, display, modify, transmit or distribute the data contained in this website without the explicit prior written permission of Fusion Media and/or the data provider. All intellectual property rights are reserved by the providers and/or the exchange providing the data contained in this website.
Fusion Media may be compensated by the advertisers that appear on the website, based on your interaction with the advertisements or advertisers.
© 2007-2025 - Fusion Media Limited. All Rights Reserved.

