AUD: The AUD/USD spiked today during RBA minutes which concluded with the board leaving interest unchanged at 2.5%. Currently trading beneath 0.908 resistance the pair still looks technically bearish on monthly and weekly timeframes.
JPY: To add to yesterday's disappointing figures was the revised Industrial Production m/m coming in at 0.9% vs 1.1% expected. Today we have monetary policy statement with the consensus from Goldman, Citi and Barclays being 'no change' to current monetary easing.
EUR: German ZEW Economic Sentiment is due out today with a consensus of 61.3. A reading above 0 suggests increased confidence, which has been rising since Dec 2012.
GBP: CPI y/y is forecast at 2%. It is worth noting that CPI has declined for 6 consecutive months, with the past 3 coming in less than forecast. Therefor a positive release may have more impact than a negative, which would add to the already string British Pound.
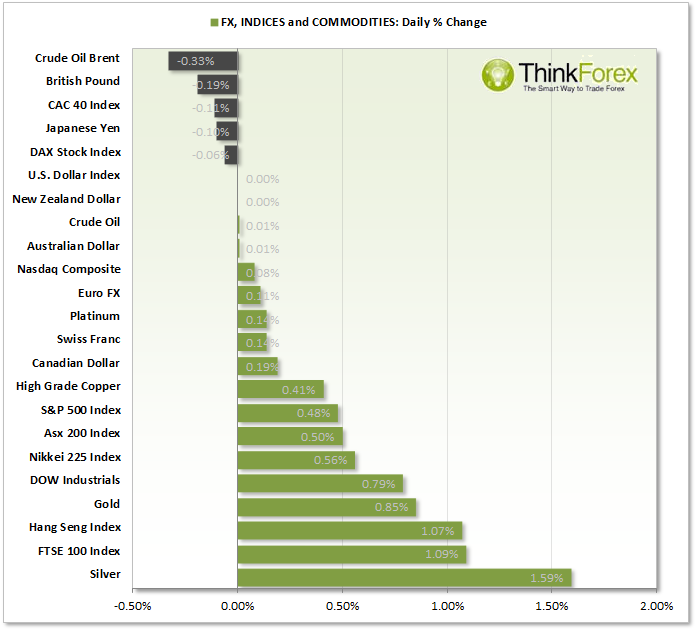
Indicies: US equities remain near or above last week's highs. FTSE100 broke through 6668 resistance en route to Jan highs. CAC40 remains near Jan highs with DAX stalling beneath 9685 resistance.
Commodities: Gold tested 1330 resistance today to see both GOld and Silver trade at 3 month highs.
Charts Of The Day:
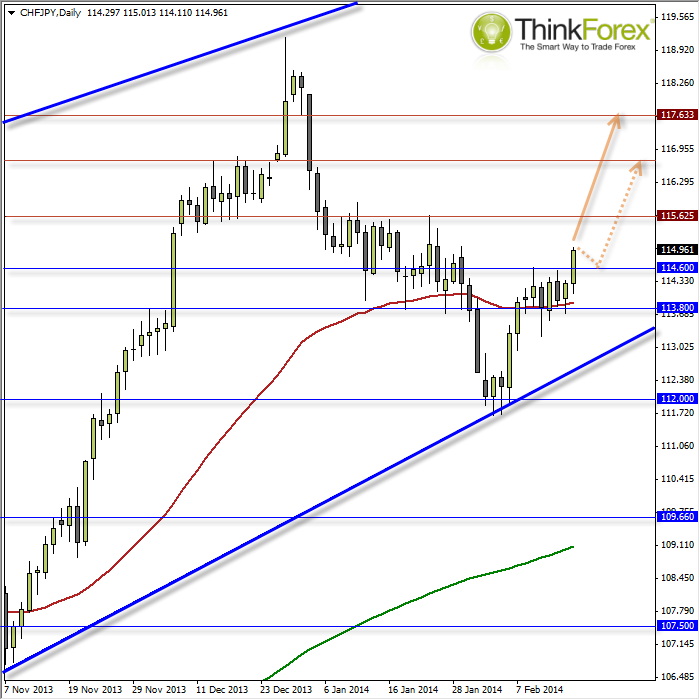
CHF/JPY: Targeting 115.625 and 117.60
 CHF/JPY Daily Chart" title="CHF/JPY Daily Chart" width="474" height="242">
For a larger view of this analysis please visit our post from 6th Feb.
It seems after the BOJ monetary policy meeting today we finally got the catalyst we have been waiting for. Whilst the pair is clearly within a well-established bull trend it has taken longer than expected to provide clues for a continuation of this trend. Today's upside breakout of 114.60 provides extra confidence that the swing low of 112 which respected the secondary trendline was in fact a pivotal low and the daily timeframe is back in line with the bullish weekly trend.
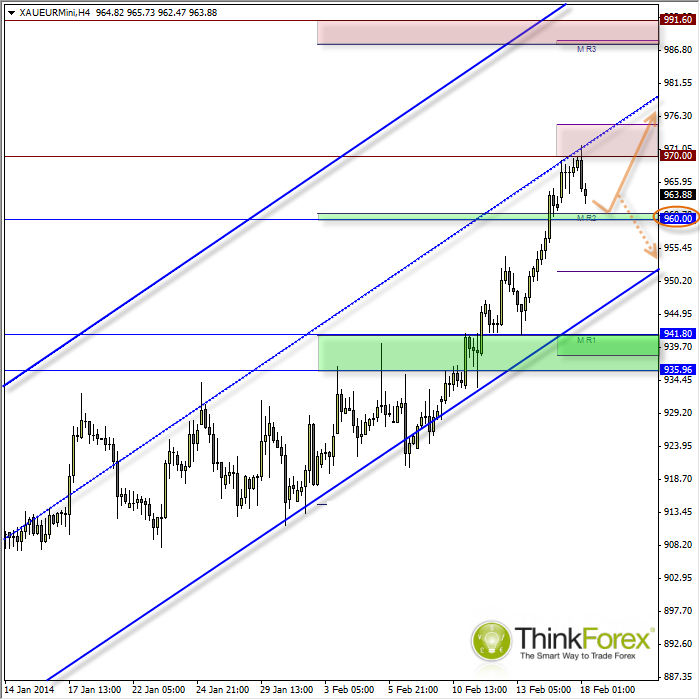
XAU/EUR: Pullback approaching 960 support XAU/EUR Hourly Chart" title="XAU/EUR Hourly Chart" width="474" height="242">
To follow up quickly on yesterday's analysis we have seen the anticipated pullback and now seeking bullish set-ups above this level of support. We are still trading around 963 and the H4 candle is yet to close so in an ideal world we will drift lower towards 960 and produce less volatile bars to suggest that 960 will hold. At this point we can decide if we want to wait for a bullish buy candle, or take upon more risk (with potential for a higher reward/risk ratio) by seeking bullish setups on lower timeframes such as H1 or even M30.

