Upcoming US Events for Today:
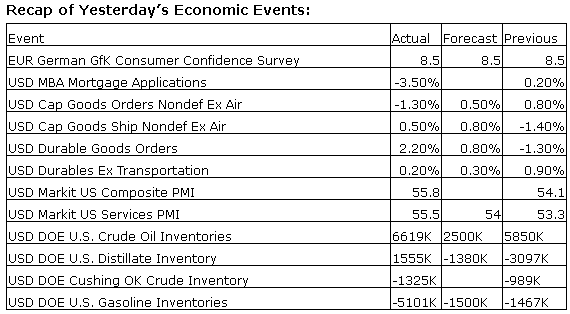
- GDP for the Fourth Quarter will be released at 8:30am. The market expects a quarter-over-quarter increase of 2.7% versus an increase of 2.4% previous.
- Weekly Jobless Claims will be released at 8:30am. The market expects 323K versus 320K previous.
- Pending Home Sales for February will be released at 10:00am. The market expects a month-over-month decline of 0.8% versus an increase of 0.1% previous.
- Kansas City Fed Manufacturing Index for March will be released at 11:00am. The market expects 5 versus 4 previous.
Upcoming International Events for Today:
- Great Britain Retail Sales for February will be released at 5:30am EST. The market expects a year-over-year increase of 2.5% versus an increase of 4.3% previous.
- Japan CPI for February will be released at 7:30pm EST. The market expects a year-over-year increase of 1.5% versus an increase of 1.4% previous.
- Japan Jobless Rate for February will be released at 7:30pm EST. The market expects 3.7%, consistent with the previous report.
- Japan Retail Trade for February will be released at 7:50pm EST. The market expects a year-over-year increase of 3.5% versus an increase of 4.4% previous.
The Markets
Stocks traded lower on Wednesday as concerns pertaining to the situation in Ukraine forced investors to de-risk. Speaking at the Council of the European Union, President Obama threatened a new round of sanctions against Russia as the Untied States attempts send an aggressive message following the annexation of Crimea from Ukraine. Equity benchmarks gave back early gains following better than expected data pertaining to durable goods orders, which kept broad market benchmarks in the green for much of the morning hours. Cyclical sectors of Materials, Technology, and Financials led the declines on the day, while defensive sectors (Health Care, Consumer Staples, and Utilities) avoided some of the heavy losses, outperforming the S&P 500 index on the session. Risk aversion remains apparent, typically a leading indication of broad market weakness.
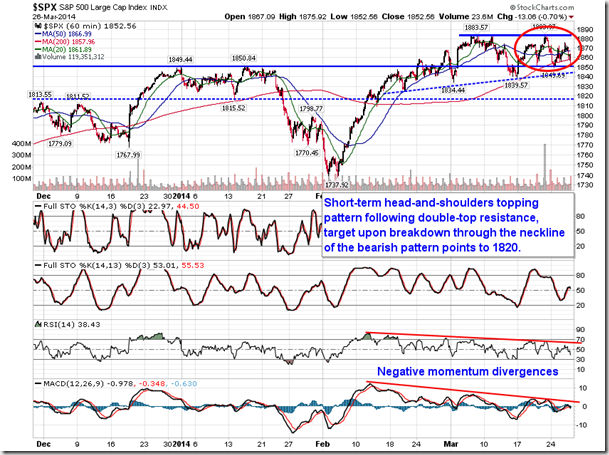
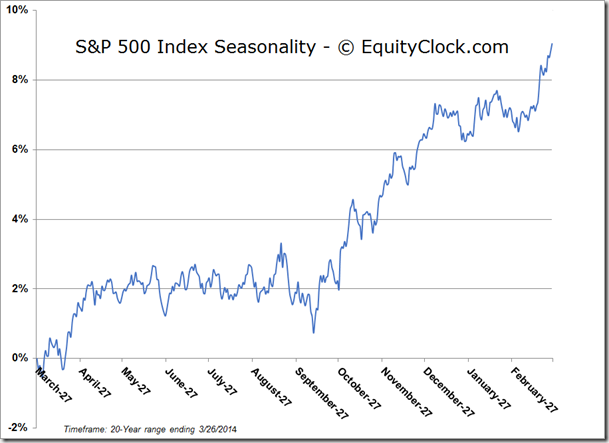
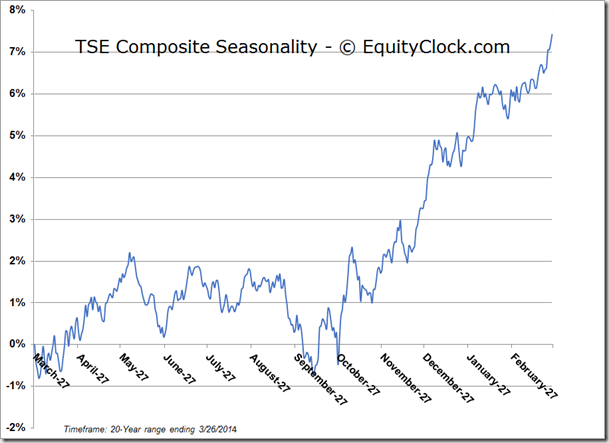
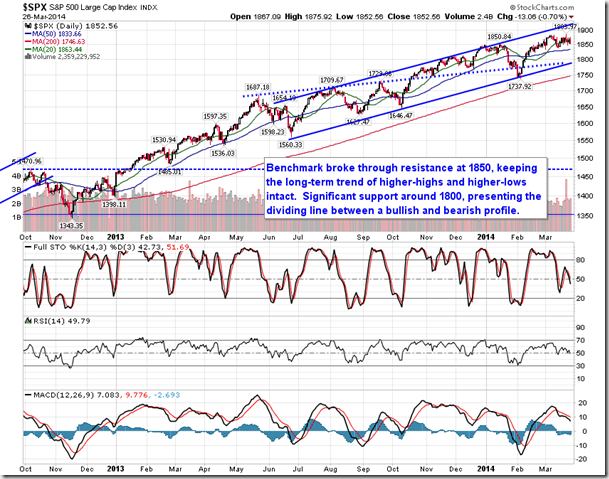
Looking at the hourly chart of the S&P 500 Index, a bearish setup becomes clearly visible. Over the past couple of weeks, a bearish head-and-shoulders topping pattern has been carved out with the neckline hovering around significant support at 1850. Downside target upon a break of the neckline points to 1820, or almost 2% below present levels. The large-cap index charted a short-term double-top during the month of March around 1883.50; waning momentum for the past month and a half has prevented overhead resistance from being surpassed. Should the short-term head-and-shoulder pattern follow through to completion, a series of support levels would be taken out like dominoes, escalating selling momentum. Below 1850, support around 1840 and 1815 present some of the last hurdles before the benchmark falls back into the 1700’s. Seasonal tendencies for the broad equity market remain positive through April, however, sell signals for the notorious “sell in May” date can be realized at any time between now and June. The weight of the market seems to be relying on that 1850 level of support.
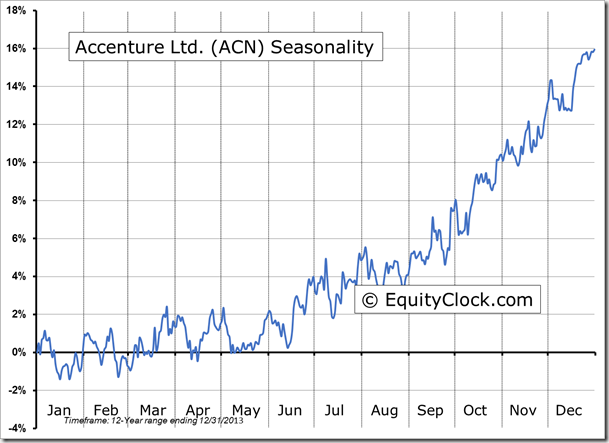
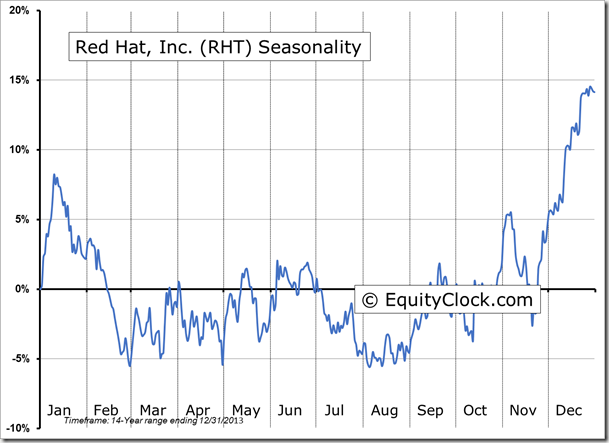
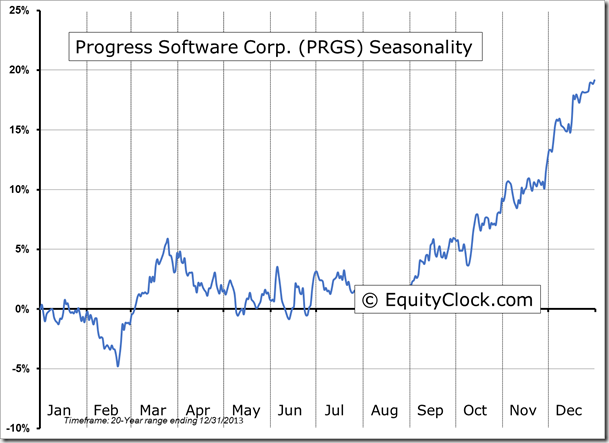
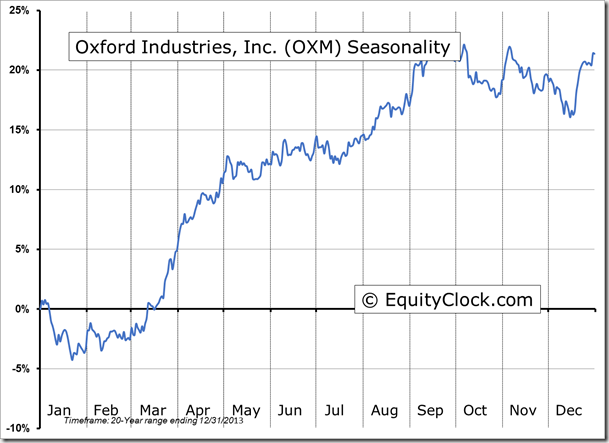
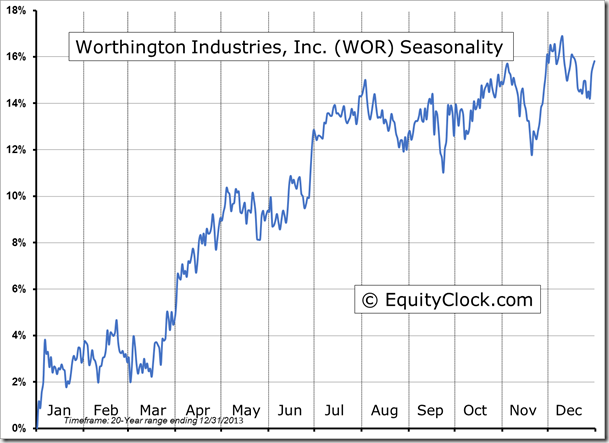
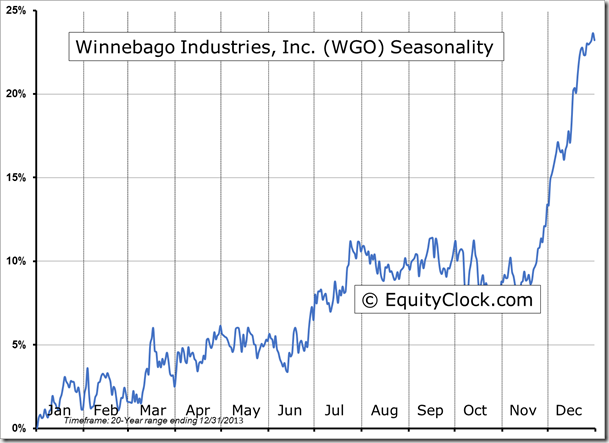
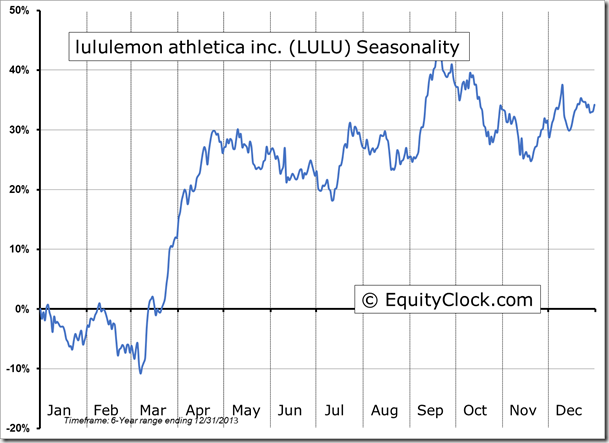
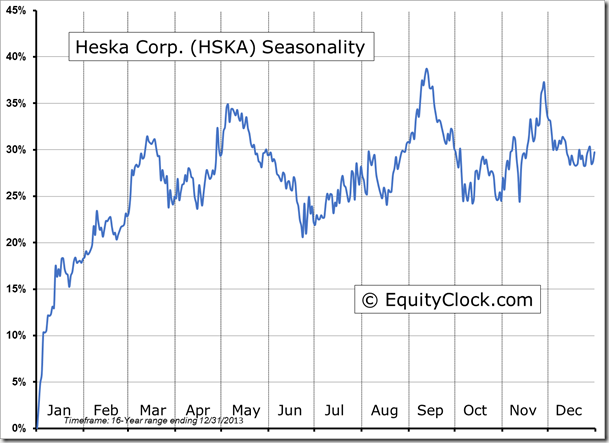
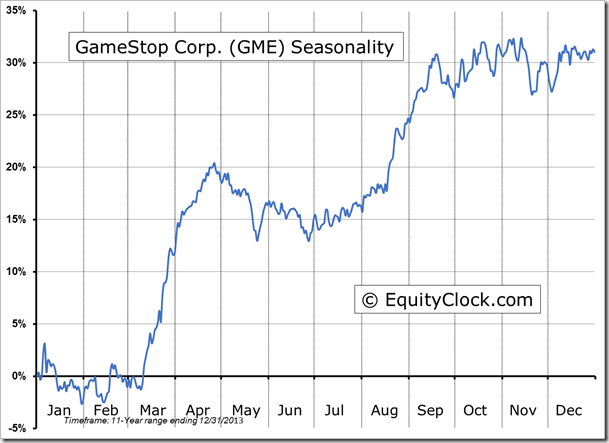
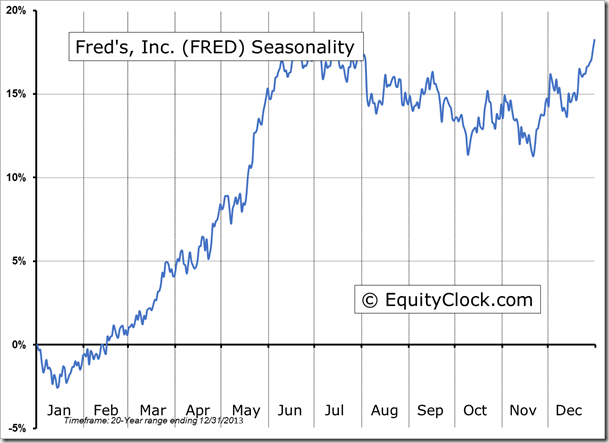
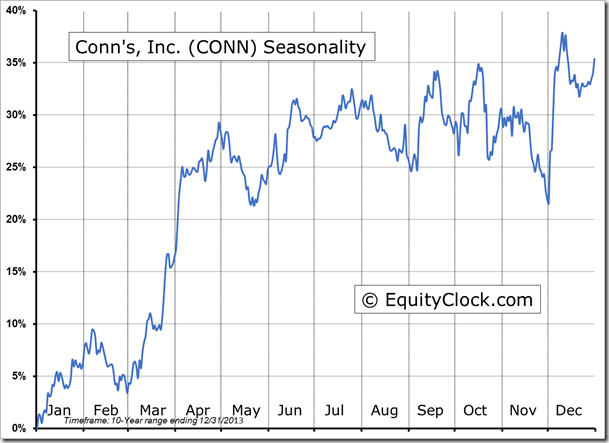
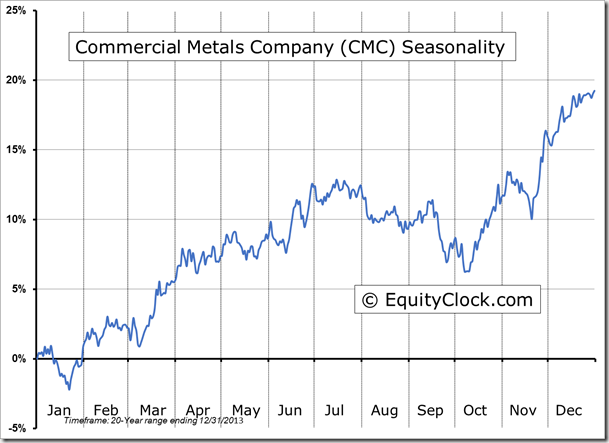
Seasonal charts of companies reporting earnings today:
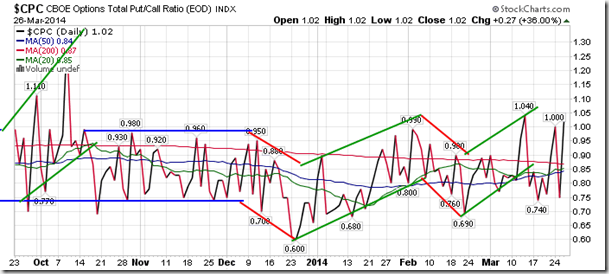
Sentiment on Wednesday, as gauged by the put-call ratio, ended bearish at 1.02.
S&P 500 Index
TSE Composite
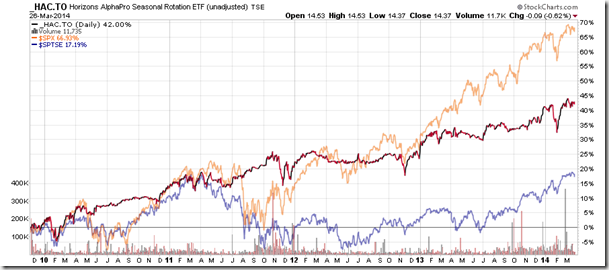
Horizons Seasonal Rotation ETF (HAC.TO)
- Closing Market Value: $14.37 (down 0.62%)
- Closing NAV/Unit: $14.39 (down 0.51%)
Performance*
| 2014 Year-to-Date | Since Inception (Nov 19, 2009) | |
| HAC.TO | 0.63% | 43.9% |
* performance calculated on Closing NAV/Unit as provided by custodian

