Summary
The purpose of the Turning Points Newsletter is to look at the long-leading, leading, and coincidental economic data to determine if the US economic trajectory has changed from expansion to contraction - to see if the economy has reached a "Turning Point."
My recession probability during the next 6-12 months remains at 20%. The long-leading indicators - especially the credit markets - show little to no stress while BEA reported corporate earnings rebounded last quarter. Some sections of the durable goods markets are soft, but that's due to the trade-related depression in corporate sentiment, which is lowering equipment investment. Coincidental data remains positive, especially consumer spending, which will likely continue to grow due to the strong labor market.
Long-Leading Indicators
The corporate credit markets show no stress. AAA yields have decreased from 3.8% in the 4Q18 to a current level slightly below 2.4%. BBB yields are 160 basis points lower over the same time period. At the very beginning of the year, CCC yields were above 12% but declining sharply. Since then, they have been trending between 10.6% and 12.5%. All three Federal Reserve financial stress indexes area at low levels. Corporate profit growth, as measured by the BEA, rebounded in the latest quarter, and M2 is rising.
Leading Indicators
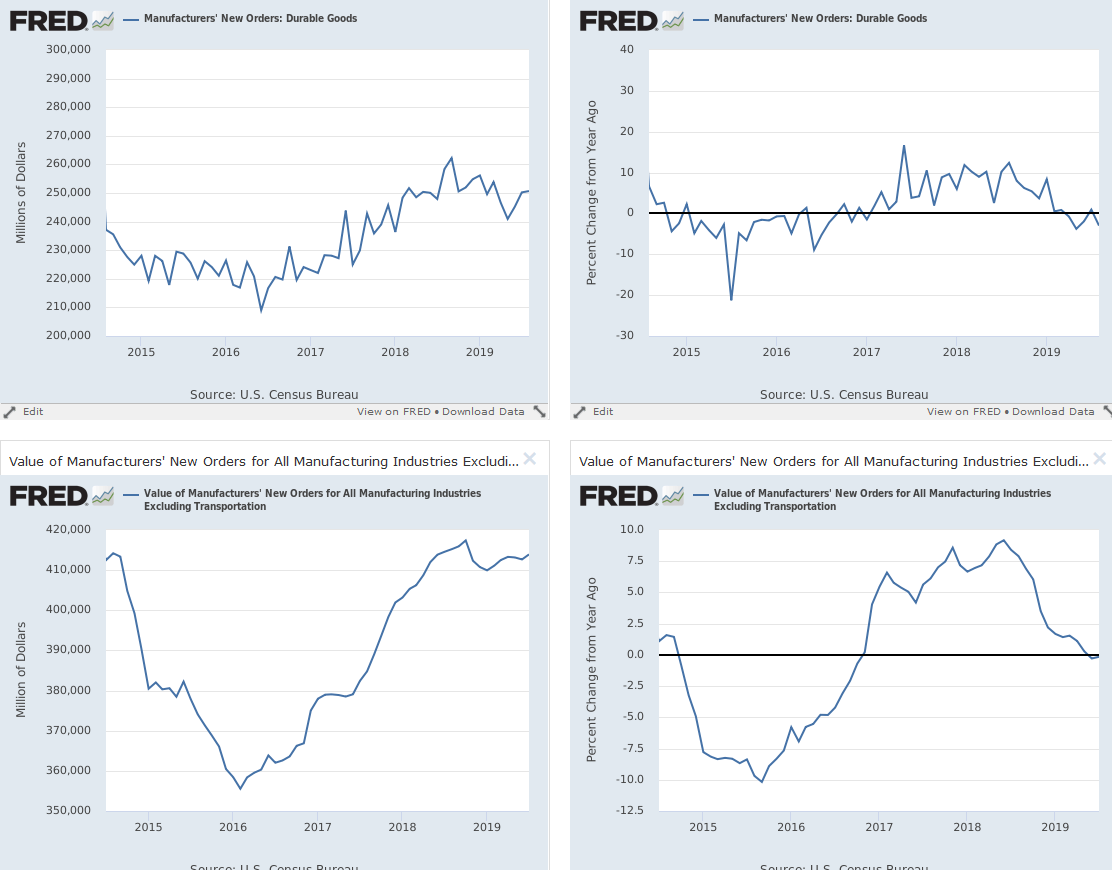
This week, the Census released the latest durable goods numbers:

Let's look at some charts of the data:
The top two charts show the total durable goods orders while the bottom charts show the data without transportation orders. In absolute dollar terms (upper left chart), total orders are declining modestly over the last year; the Y/Y data (upper right chart) has mostly been contracting over the last half-year. The data without transportation orders (lower left chart) has been trending sideways for most of this year; on a Y/Y basis (lower right chart), the data is now contracting.
The data for durable consumer durable goods is modestly better:
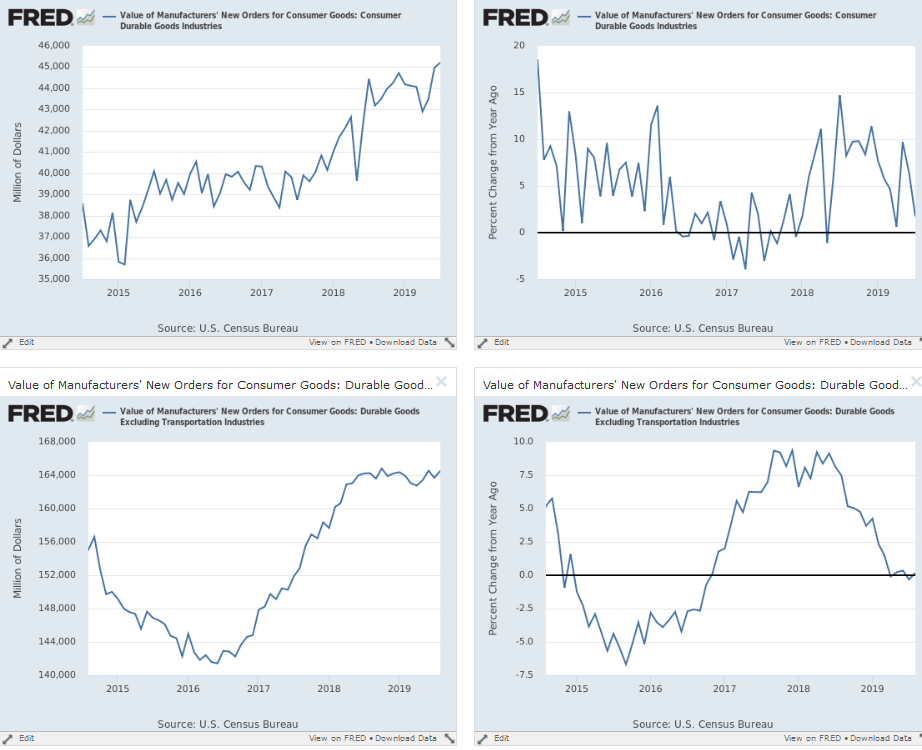
The top two charts show the total data for all consumer goods; the data is at a 5-year high in total dollar terms (upper left), while the Y/Y rate of increase is positive but volatile (upper right). The variability is due to transportation orders: the data ex-transportation orders (autos) has been flat for the last year (lower left); it is contracting modestly on a Y/Y basis (lower right).
Business orders for equipment are in a holding pattern:
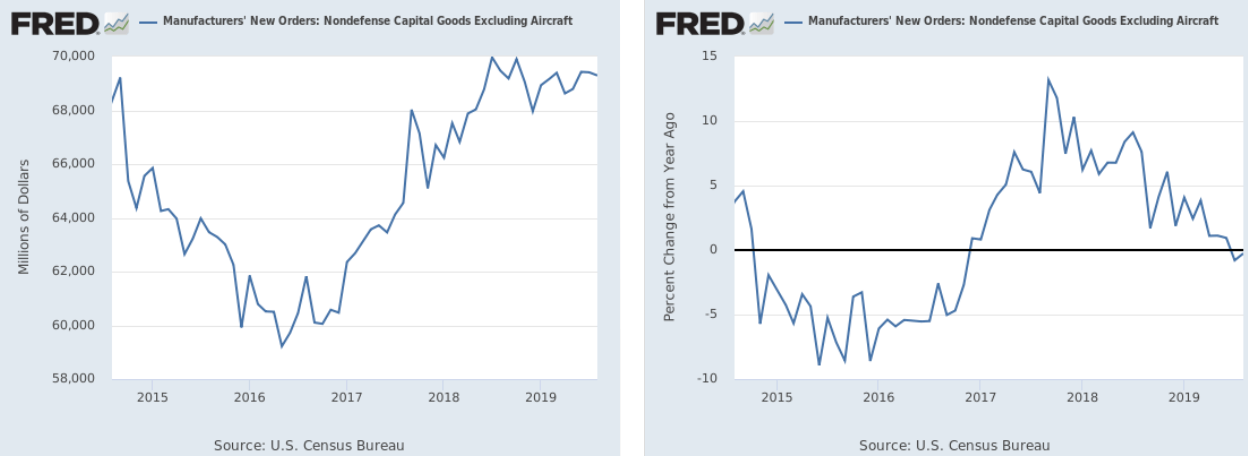
Capital goods, excluding aircraft, are trending sideways in total dollar terms (left chart) while contracting on a Y/Y basis (right chart).
The final weakness in the leading indicators comes from the yield curve:
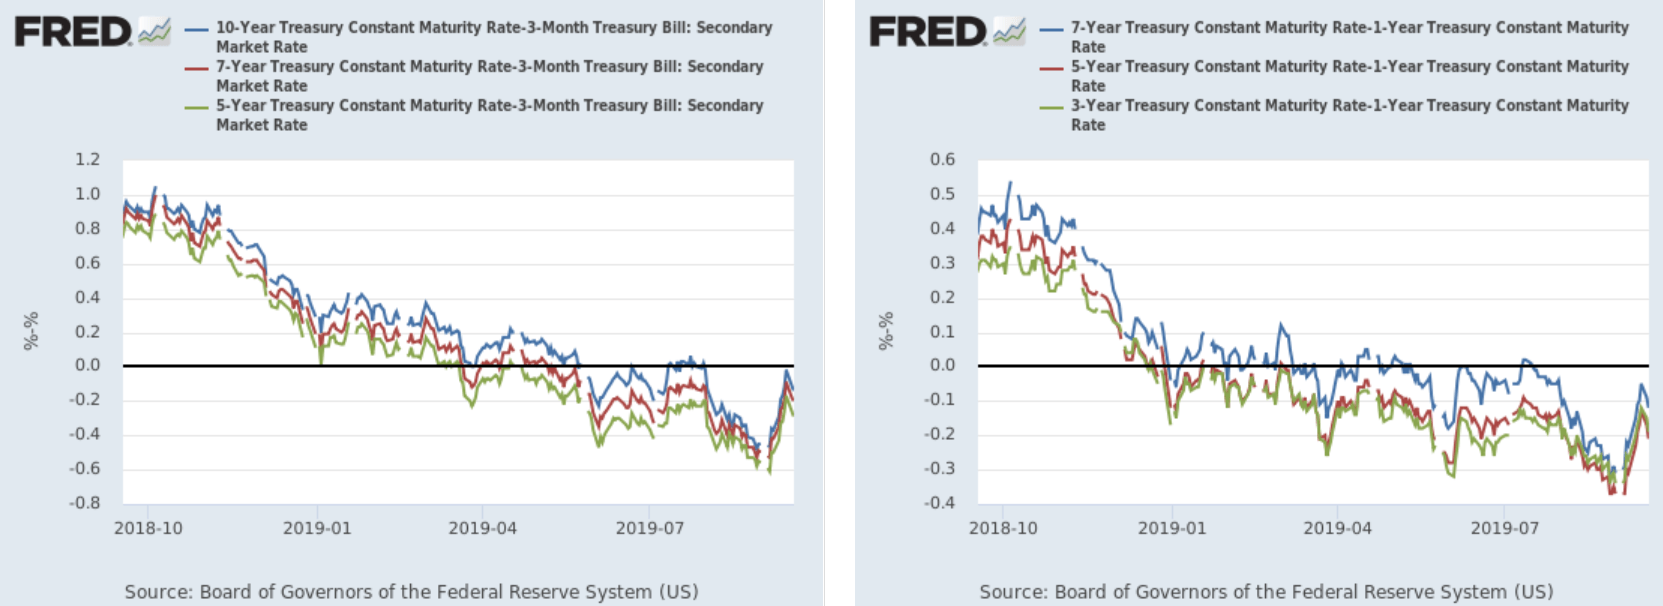
Various measures of the belly of the yield curve have been inverted for -- in some cases -- the entire year (right chart). While the degree of the inversion has lessened over the last few weeks, it is still negative.
Coincidental Data
This week, the BEA released the final reading of 2Q18 GDP:
Real gross domestic product (GDP) increased at an annual rate of 2.0 percent in the second quarter of 2019 (table 1), according to the "third" estimate released by the Bureau of Economic Analysis. In the first quarter, real GDP increased 3.1 percent.
Here's a graph of the contributions to the percent change for the last year:
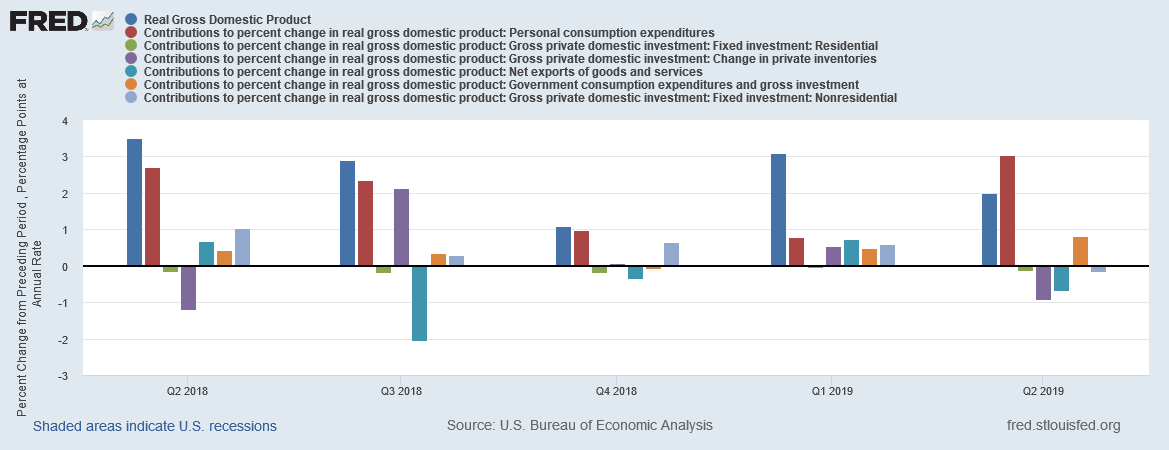
The total change in GDP is in blue, while the latest report's data is on the far right. Personal consumption expenditures (in red) are clearly the largest contributor to the 2Q19 data; government consumption spending is the second largest. All other areas of the GDP report are subtracted from the total.
This data is three months old, making it somewhat less timely. However, on Friday, the BEA released the latest monthly personal consumption expenditure data, which was positive:
Personal income increased $73.5 billion (0.4 percent) in August according to estimates released today by the Bureau of Economic Analysis. Disposable personal income (DPI) increased $77.7 billion (0.5 percent) and personal consumption expenditures (PCE) increased $20.1 billion (0.1 percent).
Here's a chart of the data:
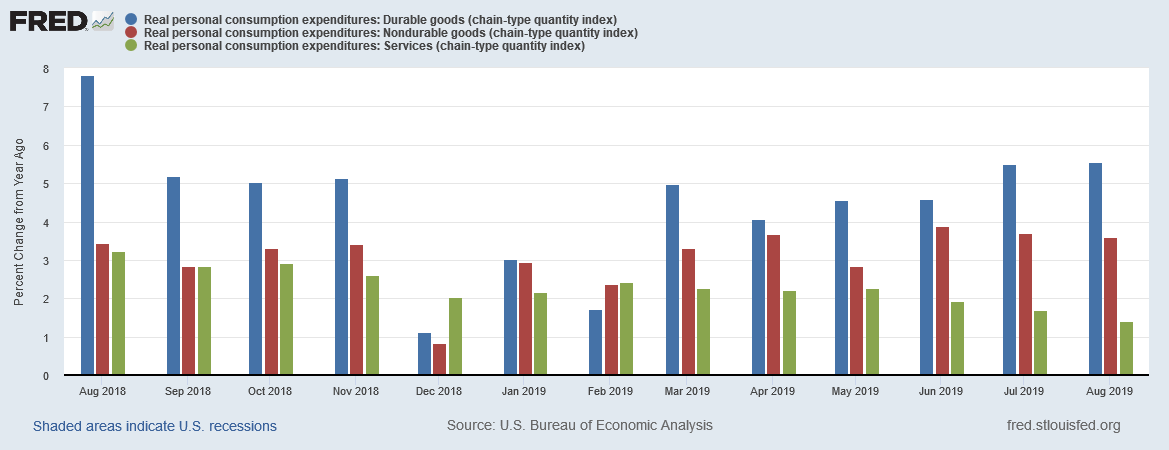
The data above shows the Y/Y percentage change in personal spending. All three categories are in good shape. Spending on durable goods (in blue) is near a 1-year high; spending on non-durables (in red) is also strong; spending on services (in green) is a bit weak, but this data usually continues to expand even during a recession.
Please see the conclusion at the top.
