Market Notes
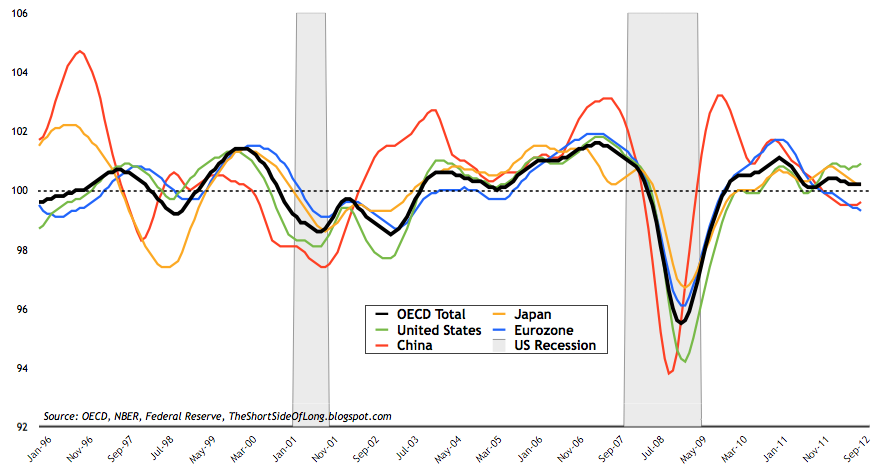
The recently published update of the OECD Leading Economic Indicators "point to diverging patterns across major economies." Eurozone growth rate continues to slow, with Japan joining the recession party.
On the other hand, the US continues to grow above par, while China stabilises for now. Germany looks very disappointing while Canadian, Brazilian and Russia growth rates have also turned down. Finally, India is showing no signs of recovery just yet.
OECD Total indicator is signalling anaemic global growth only three years into the recovery phase, despite the unprecedented global stimulus as mega trillion dollar cheques were written. In my opinion, since we are at stall speed, it is now only a matter of time until some-event, some-where in the world triggers a cascading slowdown that enters into a global recession, as we find ourselves in the very late cycle of the expansion.
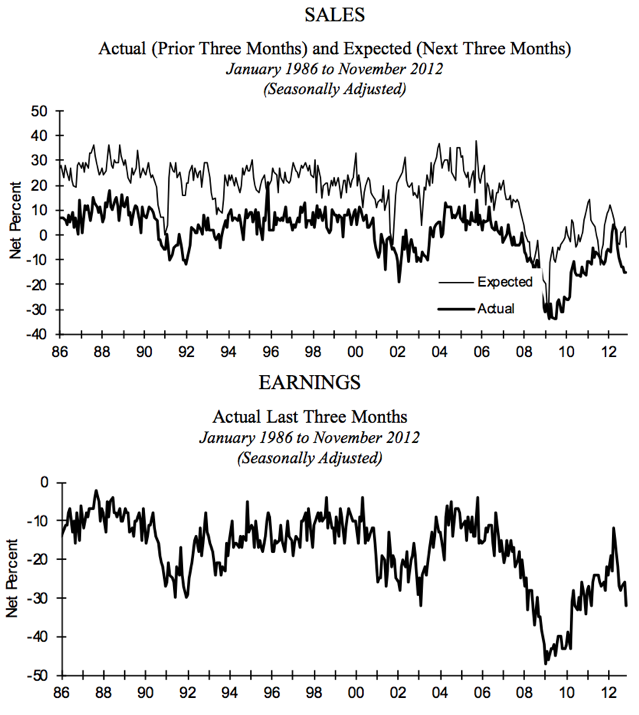
There has been a lot of discussions towards the Fiscal Cliff and how it is impacting the price of equities. The Media has attributed every sell off and every rally towards the political negotiations in Washington. However, in my opinion, behind the curtains the economic cycle is slowing and companies are now starting to struggle... but bullish investors are not paying attention.
Bull market leaders like Apple (AAPL) are not declining because of the Fiscal Cliff, but as investors forecast disappointment in sales and earnings. This is also evident when we look at the health of small businesses in the US, the backbone of the private sector. In the charts above, we can see clear evidence that the majority of companies are entering a period of slowing sales (anaemic consumer demand) and therefore falling earnings.
During the late stage of a business cycle, when earnings start to disappoint, companies start cutting capex plans and begin trimming expenses (including workforce). These factors are bound to contribute towards lower growth and higher unemployment in the coming quarters (lagging indicators).
Of course, the US government could step in place of the private sector by increasing its spending deficit to even higher levels. However, with the public's eye on the US government budget thanks to the constant media attention, it seems that it is only a matter of time until the US also enters austerity. It is worth noting that previous rapid collapses in small business earnings lead to a recession in 1990, 2001 and 2008.
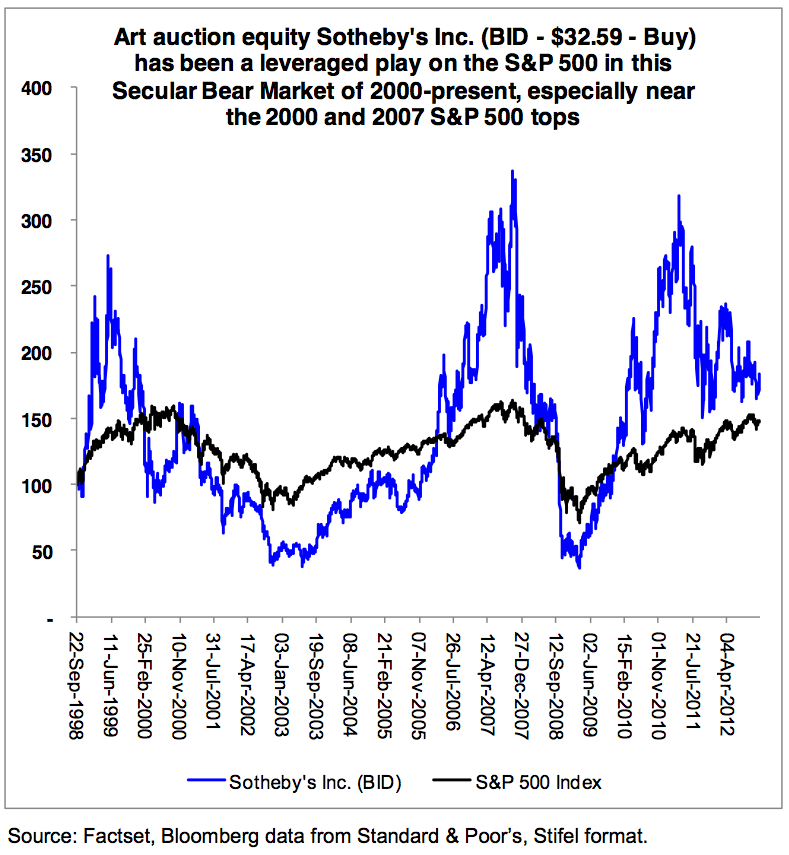
Luxury art dealer Sotheby's (BID) has been a leveraged speculative play on asset booms during the reflationary phase of the current secular bear market in equities. While not perfect, the company price itself has also been a great indicator of bull market tops, including the previous peak in 2000 and 2007.
It has been my view for a while that a real equity market top already occurred in May of 2011, just as Sotheby's was peaking in its blow off top phase. After all, the broadest measures of stock prices such as the NYSE Composite, Russell 2000 and Broad Market Value Line have not exceeded their respective 2011 highs. Neither have any of the major global indices such as the STOXX Euro 50, Emerging Markets or Frontier Markets. Therefore, we can assume that the majority, if not all, of the gains have already been squeezed out of the March 2009 bull market. The bulls are being overly bullish for the sake of single digit percentage returns at best, while major downside risks are developing. I do admit that some of these global indices could outperform US equities in the coming quarters, but the question is - will they outperform during an uptrend or a downtrend?
I think it is time for another Precious Metals update. The last post I did on this subject was way back on October 20th, with a conclusion that "in a bull market, we are meant to be buying (sounds simple, but many forget this basic rule). However, I won't just buy at any point or any price. I would like to see some or maybe even all of the following criteria, before I add further funds to this asset class:
So the goal of today's post is to check up on the PMs sector and see if any of the criteria listed above is currently in development.
The prices of Gold and Silver have been in consolidation mode since late September, when I stated that "from their respective lows during the summer bottoming phases Gold has rallied 14%, Platinum has rallied 20%, Palladium has rallied 22% and Silver has rallied 30%. Precious Metals have now become overbought from the near term perspective and sentiment has risen towards extremes again. Elliot Wave shows that the Daily Sentiment Index, measuring the short term view of future traders, records 90% bulls on Gold and 92% bulls on the Silver. Therefore, I would pull back from purchasing any Precious Metals right now, until we see some kind of a consolidation or a correction."
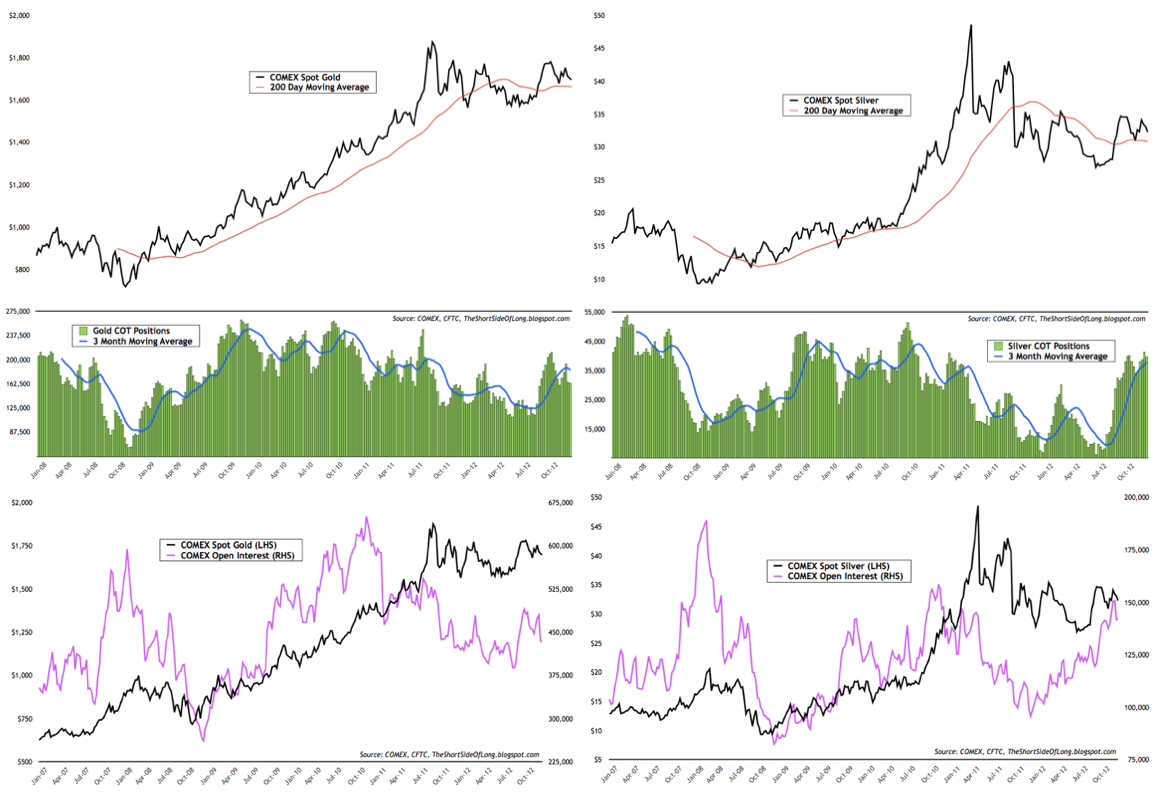
Many gold bulls, who were predicting almost vertical rises in PMs sector and especially Gold Miners, have been disappointed with the relatively muted price action. The chart above, thanks to the COT report, also shows that hedge funds and other speculators have not been shaken out just yet, as they continue to hold decent exposure in Gold and quite extreme exposure in Silver. Positioning in Platinum and Palladium is also quite extreme, so all in all, speculative money still dominates the PMs space. Unfortunately, the contrarians amongst us will have to wait longer and possibly put up with lower prices, before weak hands flee the market and a bottoming process re-starts.
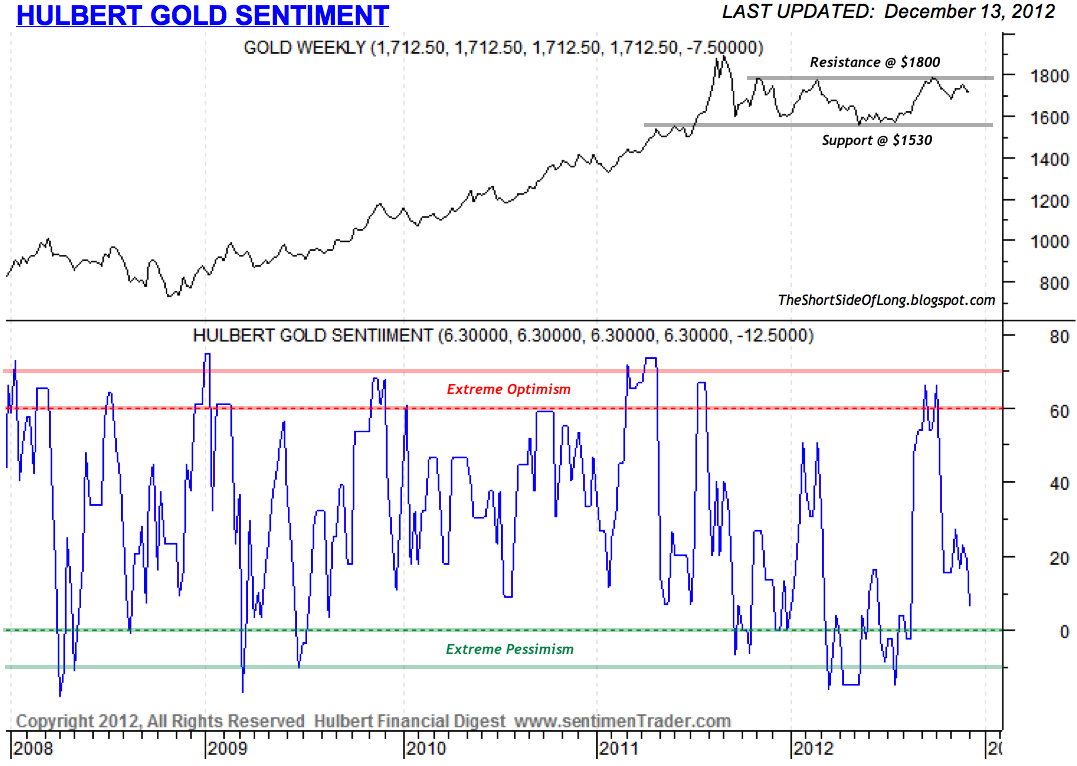
However, not all is lost. There are signs that sentiment has dropped significantly in other indicators, as traders fear lower prices. According to the latest Hulbert Gold Sentiment Index, newsletter advisors are recommending one of the lowest exposures to Gold since at least August of this year. The average client now holds about 6.3% net long exposure as of earlier in the week, when Gold traded at 1712. Recent price falls might have pushed this reading into "extreme pessimism" territory.
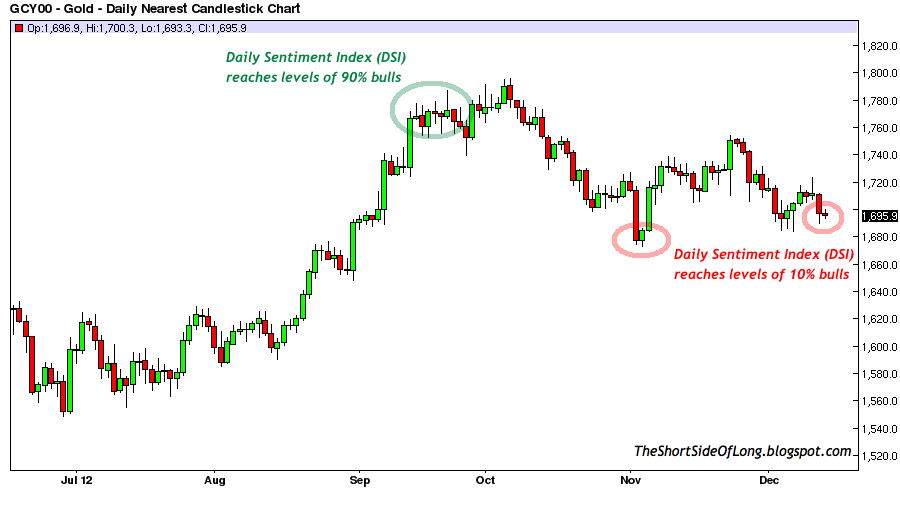
Furthermore, while the Daily Sentiment Index was registering readings of 90% bulls and higher in late September, as of Friday Gold's DSI stood at only 10% bulls. This is a similar reading to early November when sentiment readings dropped to single digits. While this might not indicate a bottom straight away, it is alerting us about the short term consensus outlook for lower prices. Since we do not want to follow the consensus into selling, our goal should be to stay alert and buy low when others capitulate.
In my opinion, a sharp drop towards $1650 would create short term panic selling and would also knock off a lot of stop losses around the $1670 area. At this point sentiment would also reach single digits, indicating Gold is ripe for a buy. I actually know of a few newsletter writers and bloggers who are praying that Gold does not go lower than $1670, as it would force them to cut their underwater positions, which were opened in October at much higher prices.
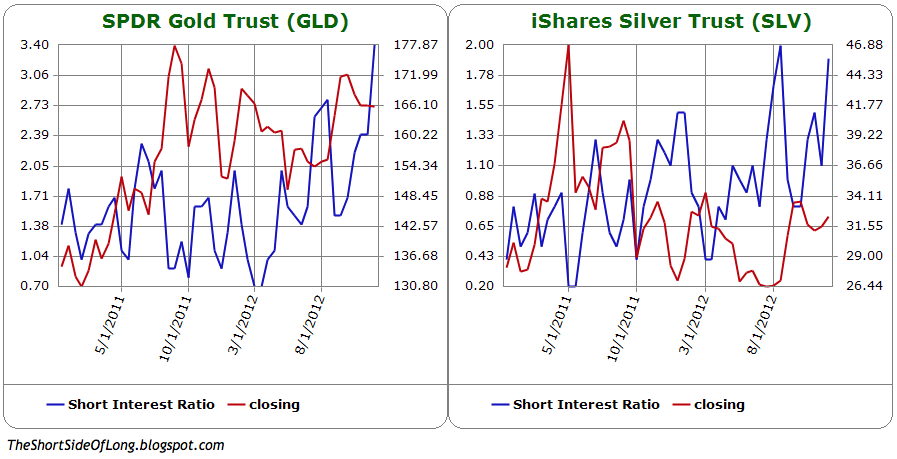
Moving right along, we turn our focus towards GLD and SLV ETFs. When I look at the recent Short Interest data, I see a lot of disbelief in the Precious Metals sector by the retail community. Remember that ETFs are easily accessible to all traders around the world and therefore have the ability to gauge what the retail crowd is doing (not just thinking). Consider the fact that we currently have 23.8 million shares sold short in GLD at a ratio of 3.4% against the float and 19.2 million shares sold short in SLV at a ratio of 1.9% against the float. Comparing that to historical data tells us that the short interest ratio as a % of float is currently very high, especially in Gold. The retail crowd has become too bearish and has sold a lot of shares in expectation of lower prices. Now, compare the recent data to the mega rally we saw during August of this year, which occurred as traders held 21.8 million short sales in GLD at a ratio of 2.8% against the float and 14.8 million short sales in SLV at a ratio of 2.0% against the float. What eventually follows is a short squeeze, but once again it is worth mentioning that this does not automatically mean we will see higher prices ahead.
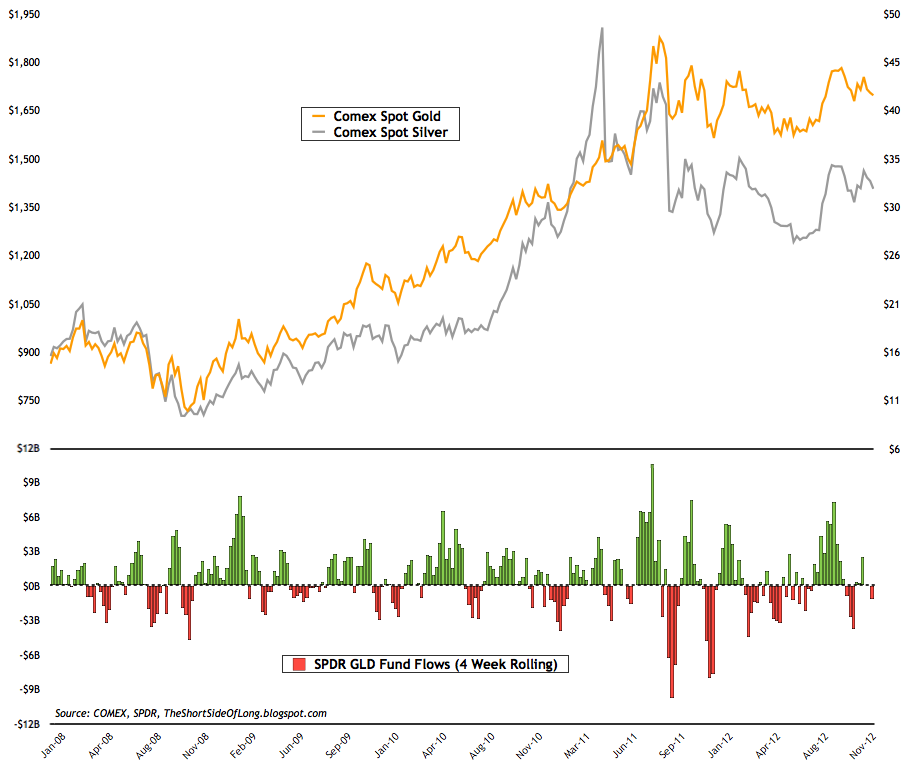
Staying on the topic of ETFs, I always like to monitor the GLD fund flows over a 4 week rolling time frame. What usually tends to indicate an intermediate bottom is a few weeks of selling, where several billion dollars or more flows out of the ETF. We haven't seen anything like that since early November, when the price of Gold was at $1670 and the price of Silver dipped below $31. But it is also worth mentioning that inflows have been rather muted too. Since late September, when just about every man and his dog expected Gold to hit $1900, fund inflows have been non-existent.
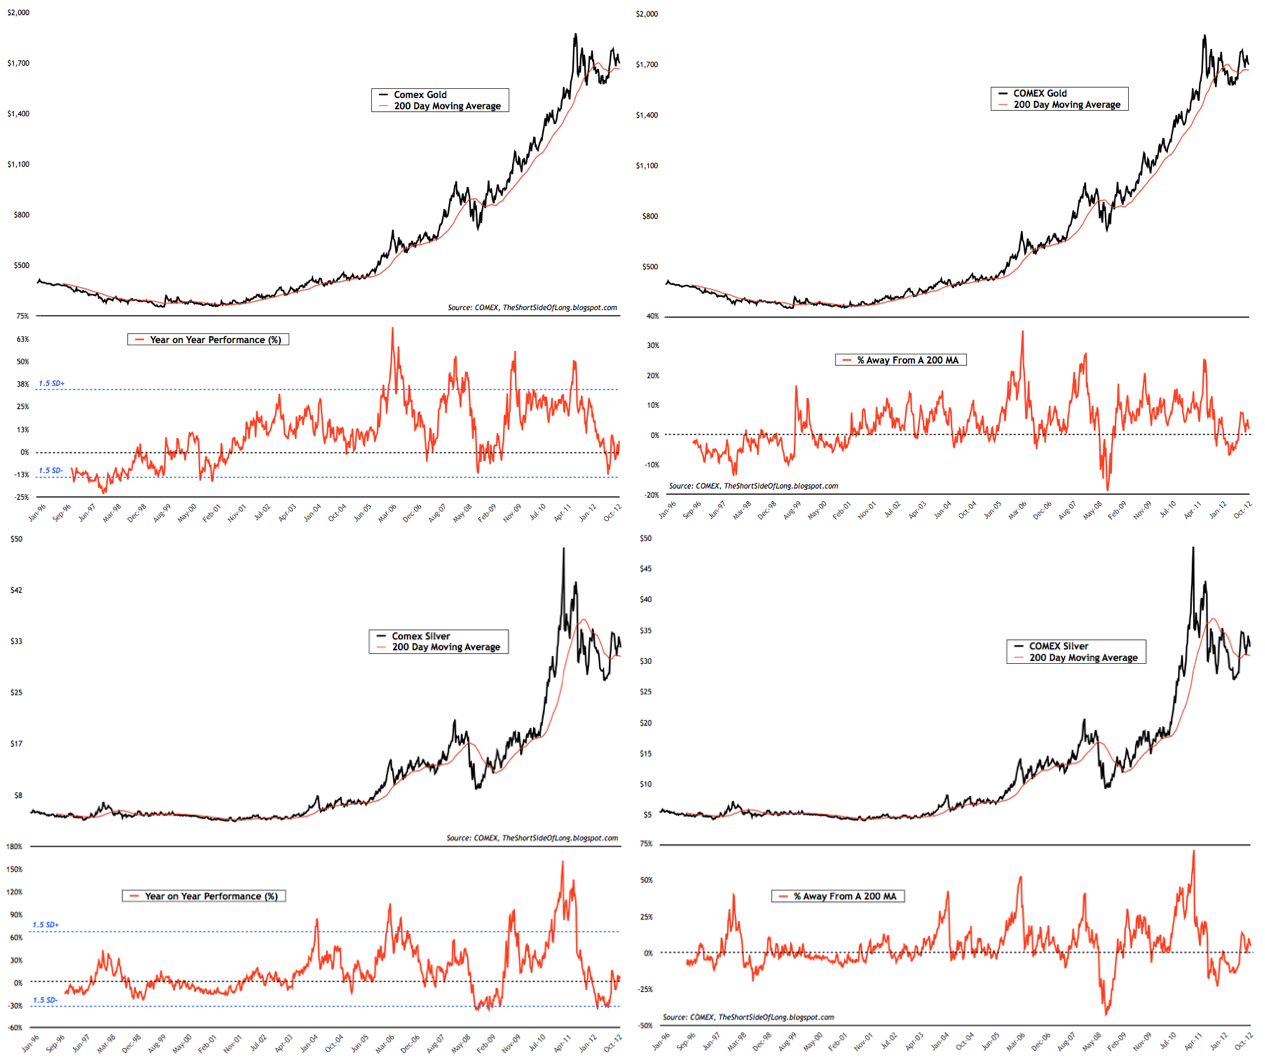
As I look at the price action of Gold and Silver, I would like to make two basic observations. First of all, on a yearly percentage basis, both Gold and Silver became oversold during the summer of this year as they both reached 1.5 standard deviations on the downside and now they seem to be in recovery mode. Second of all, the price of Gold and Silver fell below the 200 MA as prices became oversold (less so in Gold) and here too we seem to be experiencing a recovery. Going forward, it will be important for both metals to hold their 200 MAs as respect towards the uptrend... so far so good. However, if the price was to fall below this line properly on a weekly closing basis in the future, it will indicate that the PMs still remain in a corrective phase of the secular bull market.
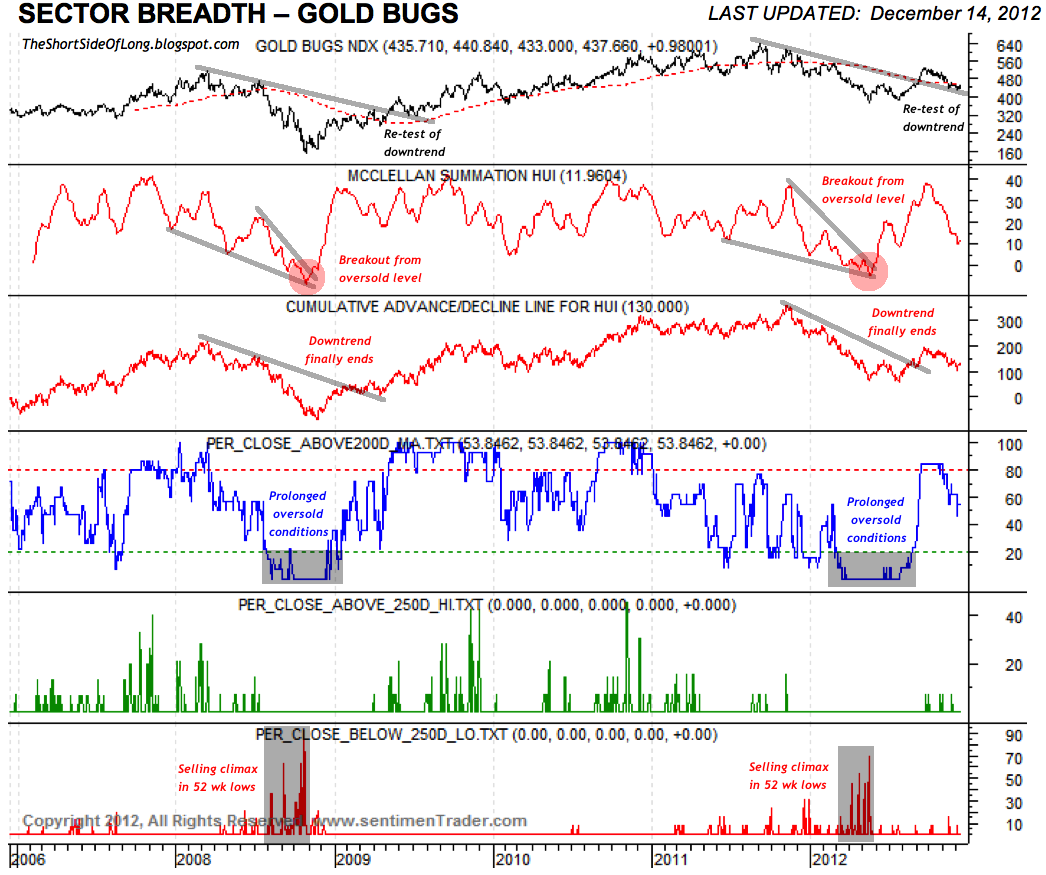
I believe the Gold Mining sector also holds a few clues for us. As I go extensively through the breadth chart, thanks to the SentimenTrader website, I notice a lot of similarities to the way Gold Miners bottomed in late 2008 and re-started a new bull market in early parts of 2009. Back than we saw extremely oversold readings on the Summation Index which eventually broke out. We saw a prolonged period of time where the number of miners trading above the 200 MA remained close to 0% and finally we saw a huge selling climax where over 75% of the sector made 52 week new lows. Looking at the chart above, one could conclude that the bottoming process between May and August 2012 holds a lot of similarities, including what technical analysts would say is a "re-test of the downtrend line". Furthermore, the Gold Miners BPI is not overbought anymore as readings have fallen from 72% in September towards 34% today. Intermediate bottoms usually occur as readings fall below 25% or less, so maybe more selling is necessary in the short term, but in the long term Gold Miners could surprise on the upside in 2013 out of the current oversold levels.
Since the article I wrote in late September, I have not really bought any major positions in this sector. I continue to wait for an opportunity which meets my criteria and the list remains basically the same:
Trading Diary (Last update 09th of December 12)

The recently published update of the OECD Leading Economic Indicators "point to diverging patterns across major economies." Eurozone growth rate continues to slow, with Japan joining the recession party.
On the other hand, the US continues to grow above par, while China stabilises for now. Germany looks very disappointing while Canadian, Brazilian and Russia growth rates have also turned down. Finally, India is showing no signs of recovery just yet.
OECD Total indicator is signalling anaemic global growth only three years into the recovery phase, despite the unprecedented global stimulus as mega trillion dollar cheques were written. In my opinion, since we are at stall speed, it is now only a matter of time until some-event, some-where in the world triggers a cascading slowdown that enters into a global recession, as we find ourselves in the very late cycle of the expansion.

There has been a lot of discussions towards the Fiscal Cliff and how it is impacting the price of equities. The Media has attributed every sell off and every rally towards the political negotiations in Washington. However, in my opinion, behind the curtains the economic cycle is slowing and companies are now starting to struggle... but bullish investors are not paying attention.
Bull market leaders like Apple (AAPL) are not declining because of the Fiscal Cliff, but as investors forecast disappointment in sales and earnings. This is also evident when we look at the health of small businesses in the US, the backbone of the private sector. In the charts above, we can see clear evidence that the majority of companies are entering a period of slowing sales (anaemic consumer demand) and therefore falling earnings.
During the late stage of a business cycle, when earnings start to disappoint, companies start cutting capex plans and begin trimming expenses (including workforce). These factors are bound to contribute towards lower growth and higher unemployment in the coming quarters (lagging indicators).
Of course, the US government could step in place of the private sector by increasing its spending deficit to even higher levels. However, with the public's eye on the US government budget thanks to the constant media attention, it seems that it is only a matter of time until the US also enters austerity. It is worth noting that previous rapid collapses in small business earnings lead to a recession in 1990, 2001 and 2008.

Luxury art dealer Sotheby's (BID) has been a leveraged speculative play on asset booms during the reflationary phase of the current secular bear market in equities. While not perfect, the company price itself has also been a great indicator of bull market tops, including the previous peak in 2000 and 2007.
It has been my view for a while that a real equity market top already occurred in May of 2011, just as Sotheby's was peaking in its blow off top phase. After all, the broadest measures of stock prices such as the NYSE Composite, Russell 2000 and Broad Market Value Line have not exceeded their respective 2011 highs. Neither have any of the major global indices such as the STOXX Euro 50, Emerging Markets or Frontier Markets. Therefore, we can assume that the majority, if not all, of the gains have already been squeezed out of the March 2009 bull market. The bulls are being overly bullish for the sake of single digit percentage returns at best, while major downside risks are developing. I do admit that some of these global indices could outperform US equities in the coming quarters, but the question is - will they outperform during an uptrend or a downtrend?

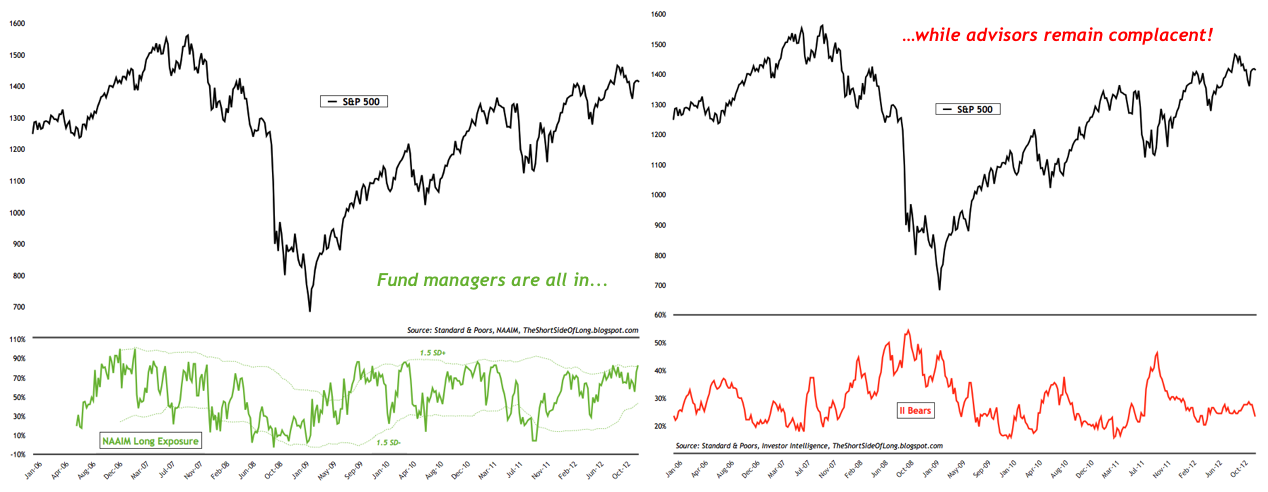
- In the recent weekly sentiment update, I've noticed that NAAIM (National Association of Active Investment Managers) showed extremely bullish exposure towards the stock market. Not only was the overall exposure the highest since the May 2011 market peak, but more importantly the number of managers positioned towards the short side was at 0%, indicating an overwhelming complacency. This is confirmed by the recent Investor Intelligence Survey, where bearish advisor readings have not ticked up since the October 2011 bottom. It seems to me that fund managers are all in, while advisors remain complacent.
I think it is time for another Precious Metals update. The last post I did on this subject was way back on October 20th, with a conclusion that "in a bull market, we are meant to be buying (sounds simple, but many forget this basic rule). However, I won't just buy at any point or any price. I would like to see some or maybe even all of the following criteria, before I add further funds to this asset class:
- sentiment surveys falling below neutrality (currently too high)
- hedge fund reducing futures positioning (currently on high side)
- market open interest speculation declining (rose too rapidly)
- retail crowd hot money leaving ETFs (currently too high)
- increase in ETFs short interest ratio activity (currently too low)
- large Put purchase levels relative to Calls (currently too low)
So the goal of today's post is to check up on the PMs sector and see if any of the criteria listed above is currently in development.

The prices of Gold and Silver have been in consolidation mode since late September, when I stated that "from their respective lows during the summer bottoming phases Gold has rallied 14%, Platinum has rallied 20%, Palladium has rallied 22% and Silver has rallied 30%. Precious Metals have now become overbought from the near term perspective and sentiment has risen towards extremes again. Elliot Wave shows that the Daily Sentiment Index, measuring the short term view of future traders, records 90% bulls on Gold and 92% bulls on the Silver. Therefore, I would pull back from purchasing any Precious Metals right now, until we see some kind of a consolidation or a correction."
Many gold bulls, who were predicting almost vertical rises in PMs sector and especially Gold Miners, have been disappointed with the relatively muted price action. The chart above, thanks to the COT report, also shows that hedge funds and other speculators have not been shaken out just yet, as they continue to hold decent exposure in Gold and quite extreme exposure in Silver. Positioning in Platinum and Palladium is also quite extreme, so all in all, speculative money still dominates the PMs space. Unfortunately, the contrarians amongst us will have to wait longer and possibly put up with lower prices, before weak hands flee the market and a bottoming process re-starts.

However, not all is lost. There are signs that sentiment has dropped significantly in other indicators, as traders fear lower prices. According to the latest Hulbert Gold Sentiment Index, newsletter advisors are recommending one of the lowest exposures to Gold since at least August of this year. The average client now holds about 6.3% net long exposure as of earlier in the week, when Gold traded at 1712. Recent price falls might have pushed this reading into "extreme pessimism" territory.

Furthermore, while the Daily Sentiment Index was registering readings of 90% bulls and higher in late September, as of Friday Gold's DSI stood at only 10% bulls. This is a similar reading to early November when sentiment readings dropped to single digits. While this might not indicate a bottom straight away, it is alerting us about the short term consensus outlook for lower prices. Since we do not want to follow the consensus into selling, our goal should be to stay alert and buy low when others capitulate.
In my opinion, a sharp drop towards $1650 would create short term panic selling and would also knock off a lot of stop losses around the $1670 area. At this point sentiment would also reach single digits, indicating Gold is ripe for a buy. I actually know of a few newsletter writers and bloggers who are praying that Gold does not go lower than $1670, as it would force them to cut their underwater positions, which were opened in October at much higher prices.

Moving right along, we turn our focus towards GLD and SLV ETFs. When I look at the recent Short Interest data, I see a lot of disbelief in the Precious Metals sector by the retail community. Remember that ETFs are easily accessible to all traders around the world and therefore have the ability to gauge what the retail crowd is doing (not just thinking). Consider the fact that we currently have 23.8 million shares sold short in GLD at a ratio of 3.4% against the float and 19.2 million shares sold short in SLV at a ratio of 1.9% against the float. Comparing that to historical data tells us that the short interest ratio as a % of float is currently very high, especially in Gold. The retail crowd has become too bearish and has sold a lot of shares in expectation of lower prices. Now, compare the recent data to the mega rally we saw during August of this year, which occurred as traders held 21.8 million short sales in GLD at a ratio of 2.8% against the float and 14.8 million short sales in SLV at a ratio of 2.0% against the float. What eventually follows is a short squeeze, but once again it is worth mentioning that this does not automatically mean we will see higher prices ahead.

Staying on the topic of ETFs, I always like to monitor the GLD fund flows over a 4 week rolling time frame. What usually tends to indicate an intermediate bottom is a few weeks of selling, where several billion dollars or more flows out of the ETF. We haven't seen anything like that since early November, when the price of Gold was at $1670 and the price of Silver dipped below $31. But it is also worth mentioning that inflows have been rather muted too. Since late September, when just about every man and his dog expected Gold to hit $1900, fund inflows have been non-existent.

As I look at the price action of Gold and Silver, I would like to make two basic observations. First of all, on a yearly percentage basis, both Gold and Silver became oversold during the summer of this year as they both reached 1.5 standard deviations on the downside and now they seem to be in recovery mode. Second of all, the price of Gold and Silver fell below the 200 MA as prices became oversold (less so in Gold) and here too we seem to be experiencing a recovery. Going forward, it will be important for both metals to hold their 200 MAs as respect towards the uptrend... so far so good. However, if the price was to fall below this line properly on a weekly closing basis in the future, it will indicate that the PMs still remain in a corrective phase of the secular bull market.

I believe the Gold Mining sector also holds a few clues for us. As I go extensively through the breadth chart, thanks to the SentimenTrader website, I notice a lot of similarities to the way Gold Miners bottomed in late 2008 and re-started a new bull market in early parts of 2009. Back than we saw extremely oversold readings on the Summation Index which eventually broke out. We saw a prolonged period of time where the number of miners trading above the 200 MA remained close to 0% and finally we saw a huge selling climax where over 75% of the sector made 52 week new lows. Looking at the chart above, one could conclude that the bottoming process between May and August 2012 holds a lot of similarities, including what technical analysts would say is a "re-test of the downtrend line". Furthermore, the Gold Miners BPI is not overbought anymore as readings have fallen from 72% in September towards 34% today. Intermediate bottoms usually occur as readings fall below 25% or less, so maybe more selling is necessary in the short term, but in the long term Gold Miners could surprise on the upside in 2013 out of the current oversold levels.
Since the article I wrote in late September, I have not really bought any major positions in this sector. I continue to wait for an opportunity which meets my criteria and the list remains basically the same:
- sentiment surveys falling below neutrality (already there but could be lower)
- hedge fund reducing futures positioning (still too high for my liking)
- market open interest speculation declining (early signs of improvement)
- retail crowd hot money leaving ETFs (early signs of improvement)
- increase in ETFs short interest ratio activity (already there and ripe for buying)
- large Put purchase levels relative to Calls (early signs of improvement)
Trading Diary (Last update 09th of December 12)
- Economic Outlook: The global economy continues to slow towards a recession, as we find ourselves in the very late cycle of the expansion. United States growth is anaemic, while the Eurozone and Japan are in a recession. German CEOs see the business cycle moving deeper into a downturn with a high probability of a recession, with Japanese business confidence continuing to shrink. Chinese growth remains slow, with a massive credit bubble lingering in the background. Most likely, a hard landing will not be avoided.
- Equities: Short positions are held in various US equity sectors, which include Dow Transports (IYT), Technology (XLK), Discretionary (XLY) and Industrials (XLI). Large put options have been bought on Apple (AAPL). Call options have been sold on Homebuilders (XHB), JP Morgan (JPM), Amazon (AMZN), IBM (IMB), Commonwealth Bank (CBA), Adidas (ADS) and others.
- Bonds: There isn't a lot of exposure in the bond space, as we believe this sector is experiencing euphoric investor demand. Call options have been sold on Junk Bonds (HYG). Plans to short Long Bond Treasuries (TLT) in due time.
- Currencies: Long positions are held in Japanese Yen (FXY). Short positions are held in Australian Dollar (FXA). The trade is now essentially short Aussie / Yen cross. Put options have been bought on British Pound (FXB) & Canadian Dollar (FXC). Put options have been sold on Japanese Yen (FXY).
- Commodities: Long positions are held in various commodity sectors, which include Silver (SLV, SIVR, PSLV, Comex futures), Agriculture (RJA, JJA) and Sugar (SGG). Plans to increase longs in PMs and Softs in due time.
