An absolutely horrific week for markets with any attempt at a bounce being sold hard with much of the weakness occurring overnight in the futures, which makes it very dangerous to try to trade at the moment.
I was long looking for a bounce using the usual leading stocks but I had to take small losses once the action told me it was not going to bounce.
Luckily I took those losses before we continued much lower to close out the week so it could have been far worse.
Markets remain very oversold and should bounce soon, but that doesn’t mean they will.
I’ll be on it if we do see a nice strong bounce but so far any attempt at a bounce has been weak and easily beaten down.
We have a long weekend with Monday a holiday so the last thing I was going to do was hold any positions over the weekend, that said, watch us open Tuesday with a huge gap higher that I can’t chase.
That’s how this game works, it’s rigged to a degree and certainly not fair, but, if you can’t, and you can’t, beat them, join them.
Learn the tactics and use them in your favour.
The trading game is about making money, not being right, but, even though I have a feeling we will see this large bounce start Monday, it was still too risky for me to hold anything over the weekend because anything at all can happen around the world an affect US markets.
As for the metals, they’re all over the place as well and not confirming each other so let’s take a look.

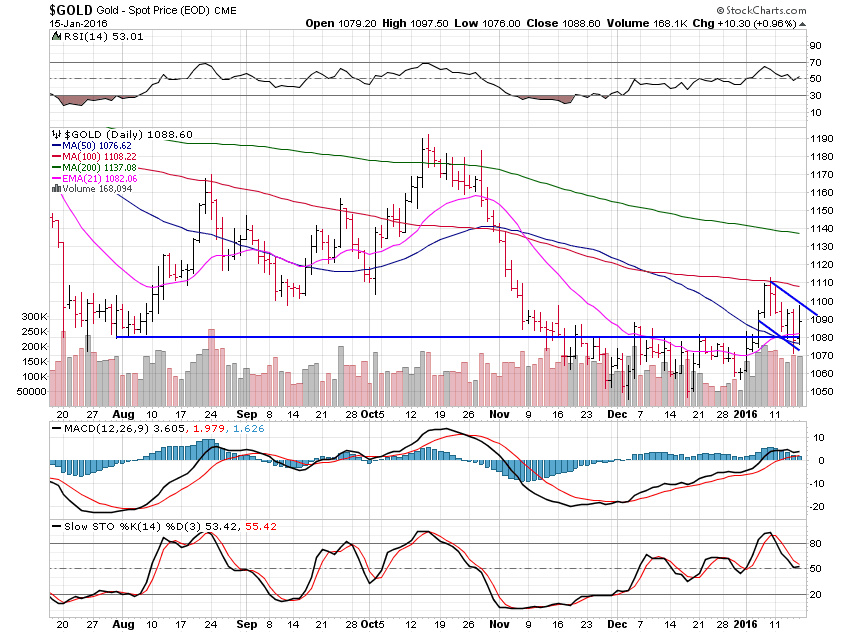
Gold lost 1.40% for the week after coming back into the range but then rising nicely in the face of the general market weakness we experienced Friday.
Gold now has a bull flag but those patterns work best in uptrends and we are far from that in gold.
If we do breakout above $1,100 and move past the 100 day average and hold on a closing basis then we should run to the 200 day average at the $1,140 area.
The caveat to that potential move is that if markets are bouncing, then any gold move is likely to fail.

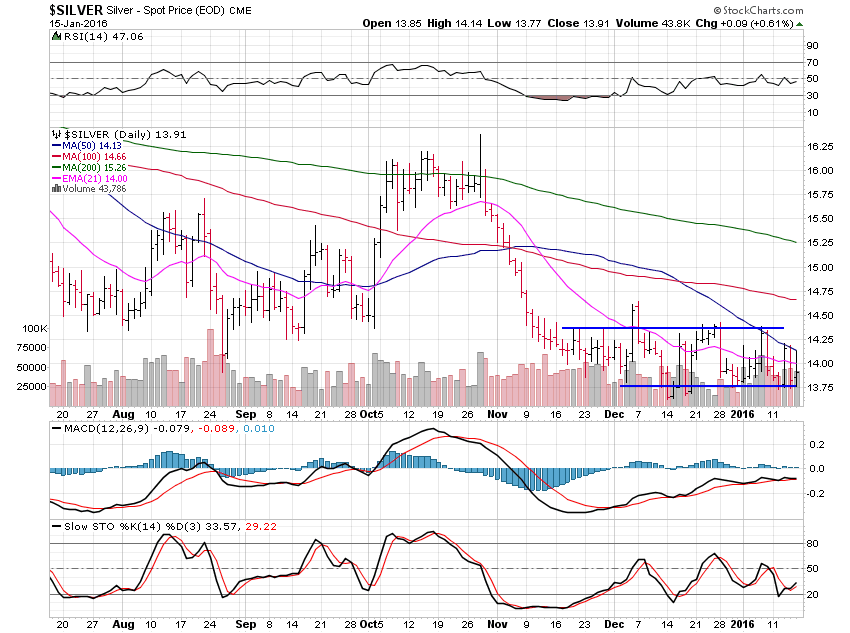
Silver was pretty flat losing only 0.11% this past week and looking weak still.
For the potential gold move to work, silver must be moving in the same direction, or confirming the move, and it is not at all.
A move under $13.75 remains a short level for silver while a move above the $14.40 area would be very positive as long as gold is also acting strongly.

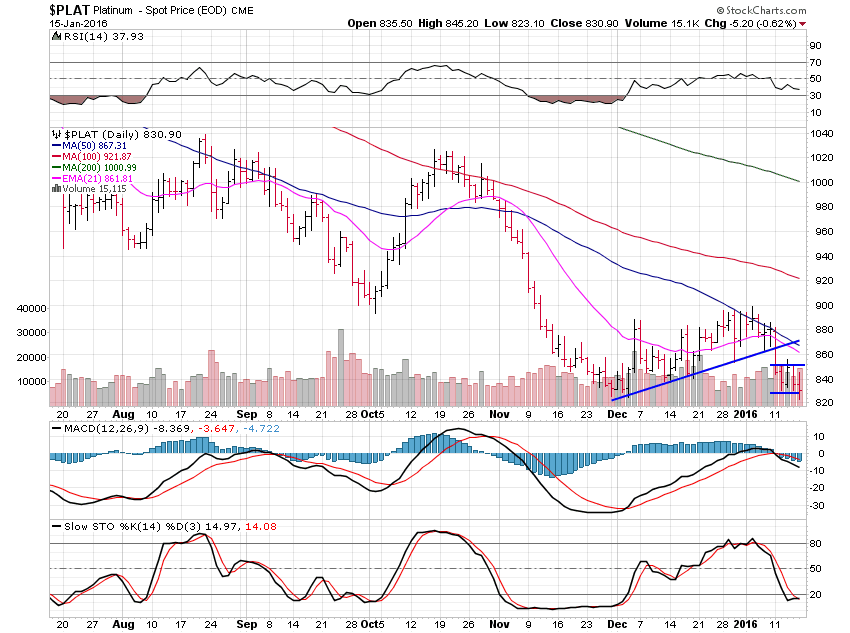
Platinum lost a hefty 5.60% and is holding on by a thread now.
A break of $820 is a short level in platinum but it has to hold under that on a closing basis and as always, gold and silver will lead so they have to at least be moving in the same direction or doing nothing before I’d consider shorting platinum.
$600 is the next major support area for platinum.
A lot of people gave me a hard time a few years ago at $1,400 when I said the $800 area was the next major support level.
It didn’t happen overnight, but here we are, and the trend remains solidly lower.

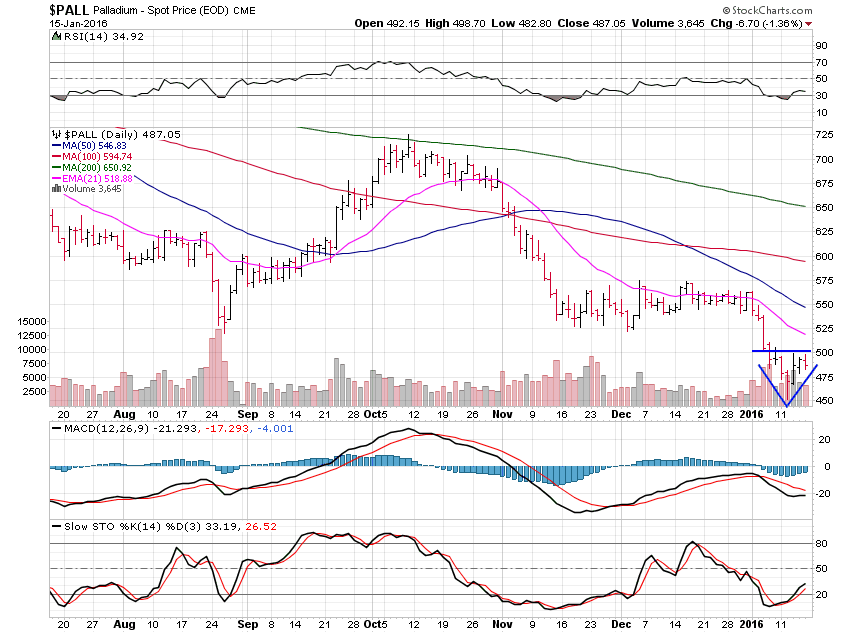
Palladium fell 1.33% this past week and is at a key area.
If we break $500 here then $400 is the next major support level to look for but we have a nice little V bottom pattern now which does tell me we will not break $500 just yet.
Let’s see how it goes but palladium and platinum seem to be taking a bit of a leading role once again but it’s still too early to say anything concrete about it.
