Since Trump became POTUS, his greatest skill is his ability to skirt potential crises.
As a trend trader, one would assume he will do the same with the Iranian situation.
The market rallied off the opening lows on Friday, as if it too assumes Trump will avert a war.
However, another reason the market found buyers is because of the bizarre relationship between economic bad news and the anticipation that the Federal Reserve will pump their way through any economic slowdown.
Clearly, this is also a trend trade that has engendered the bullish sentiment.
With a teflon President and a belief that low rates will continue to save the day, why should anyone imagine 2020 will be any different than 2019?

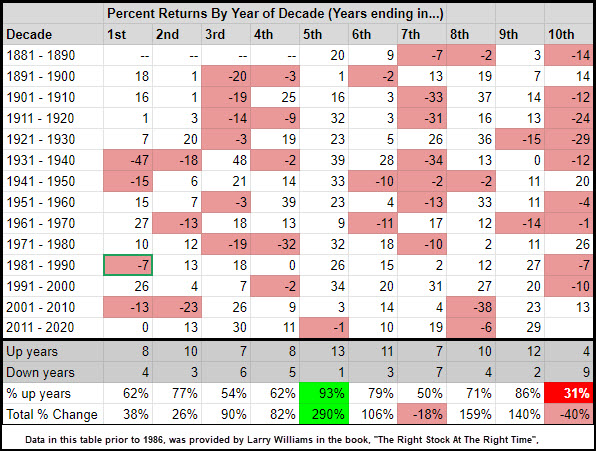
Larry Williams provides this table that represents performance of the stock market in decades since 1881.
The top of the chart pictured shows each year of the corresponding decade (1st year, 2nd year, 3rd year, etc.).
The Dow Averages were first published in 1885. That explains why the years 1881-1884 are blank.
By 1885, the market rose 20%. More noteworthy, is that by the beginning of the next decade, or 1890, the market was down 14%.
As we look at the rest of the decades, mid-decade has the most gains, while the start of a new decade has the most losses.
The decade between 1930-1940 included a market crash and a depression. Similarly, the decade beginning in 2000 into the first 2 years of the next decade, saw the dot.com bubble.
And the 8th year of the decade 2001-2010 was the financial crisis.
Nevertheless, the overriding point this chart makes is that only 31% of the time do markets end higher at the start of a new decade.
On average, if you add up all of the 13 decades represented (2020 just beginning and not included), the cumulative percent change yielded a negative return of 40% or about minus 3.1% per year.
Furthermore, in total, the zero-ending years have had 4 up years and 9 down years.
Percentages suggest a negative return for the market this year by more than 2:1.
Trump, Federal Reserve, can you change the odds?
S&P 500 (SPY) 322 super pivotal and then 320 key.
Russell 2000 (IWM) Must clear 167.12 with 166 pivotal and 163.70 support
Dow (DIA) New all-time high 288.63 with 285.50 support
Nasdaq (QQQ) New ATH at 216.16 with 213 pivotal support
KRE (Regional Banks) 57.25 support, 59.50 resistance
SMH (Semiconductors) New ATH at 144.94 with 142.40 pivotal. Below, could see move to 135.
IYT (Transportation) 195 is still key pivotal area. 200 key resistance. 192.50 support
IBB (Biotechnology) 121.50 resistance and 115.50 support
XRT (Retail) 45.41 pivotal. 46-47 resistance. 44.70 the 50-DMA
