After years during which it was considered to be in a protracted bear market, an array of macro fundamentals—including global instability during 2019, to more recent coronavirus fears and related steep global equity declines—are now boosting gold’s appeal as a safe haven against geopolitical uncertainty.
The softer dollar and a persistent negative interest rate environment are also key drivers of this gold-supportive trend.
Consider the yellow metal's trajectory: at the end of 2018 gold was trading around $1,200; as of yesterday it had hit an intraday high above $1,700, the highest for the commodity since December 2012.

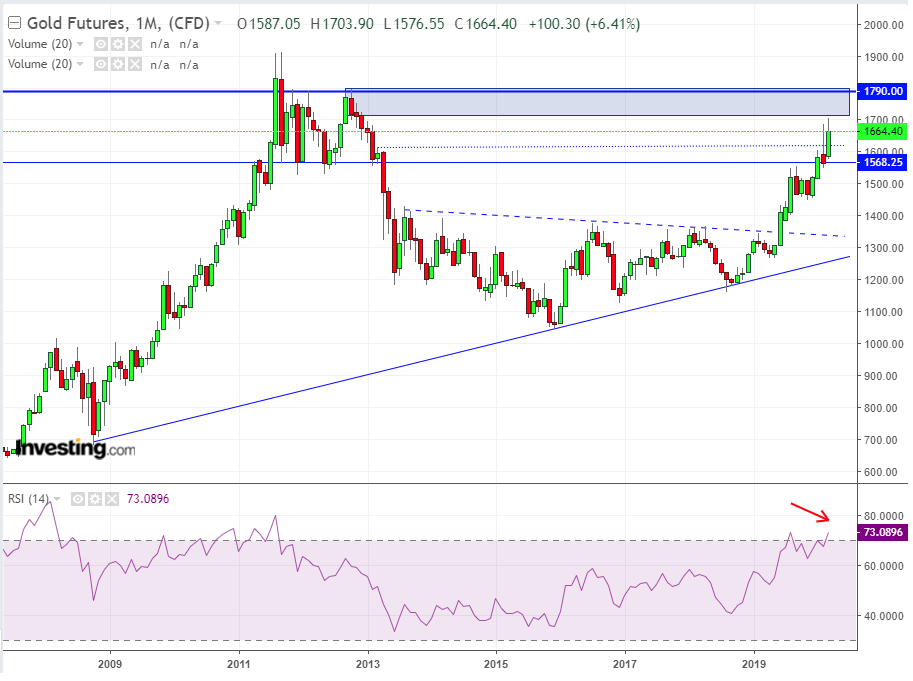
After moving in a multi-year symmetrical triangle, visible on the monthly chart, gold futures breached higher last June, (above the dashed blue line), and have now reached the supply zone of 1,715-1,800.
Last month's candle closed as a shooting star, suggesting sellers are waiting around the lower level of that supply zone, but so far the uptrend remains intact. RSI on the monthly chart is already overbought, but that's never stopped gold from heading much higher in the past.
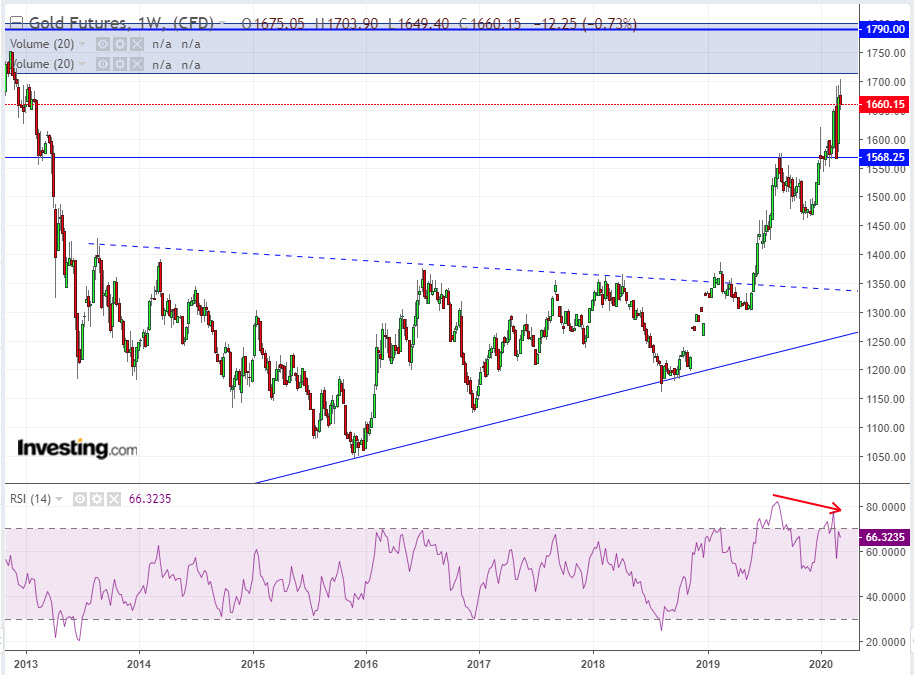
There are two immediate support levels below the current price: 1,600 and 1,568. Above the current price the strongest resistance level lies at 1,790.

On the weekly chart, the support level of 1,568 has been tested a few times but so far it's holding. However, the RSI's bearish divergence is showing some weakness.
Gold is now in a war zone between buyers and sellers. Along with the market's high volatility, we're expecting to see high volatility around these levels as well.
