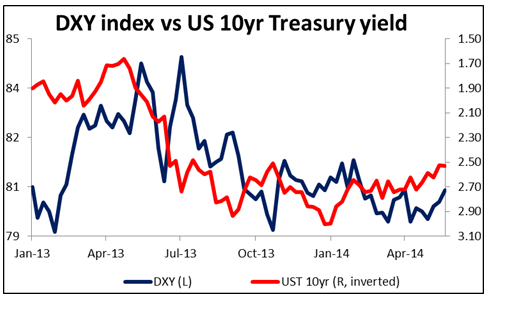
Disconnect between US rates and USD One of the mysteries of the financial markets nowadays is the disconnect between US interest rates and the direction of the USD. Interest rates have been falling and falling – 10-year yields peaked at the end of last year at 3.03% and are now down to 2.43%. Fed Funds expectations have fallen dramatically as well, not just from their peak last September (down 100 bps) but even from their level at the beginning of the month, before the better-than-expected nonfarm payrolls came out (down 31 bps). Yet the dollar has gained 0.9% over the month, as measured by the DXY Index . Usually, higher interest rates pull a currency up and lower rates push it down. What’s going o
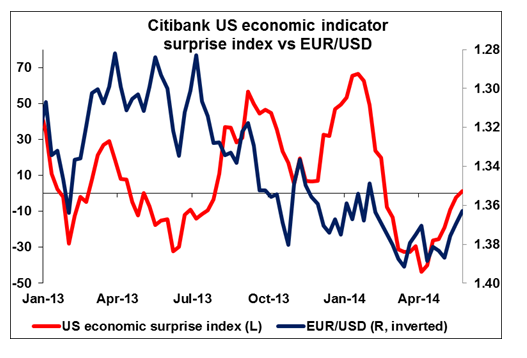
Part of the dollar’s strength is no doubt due to the weakness of the euro. The ECB’s apparent resolve to loosen policy further, including instituting negative rates, is helping to boost the dollar. But it’s not only that – USD is up in May against most other G10 currencies, including 1.6% vs CHF, 1.0% vs NZD and 0.6% vs GBP (although it’s down vs JPY, CAD and NOK). One reason is that with European yields also declining, Treasuries retain a healthy (although narrowing) yield advantage. Also, the dollar is following the better US economic news – it’s been rising more or less in parallel with the economic surprise index, a measure of how far indicators exceed or fall below expectations.
But if positive economic surprises are helping to support the dollar, then they should also be pushing Treasury yields higher, not lower. Morgan Stanley explained yesterday’s Treasury rally by saying “positioning was again the prime suspect in this latest in a run of seemingly out-of-the-blue rallies in recent weeks.” They say the recent rally has been due to a shift out of “net short/underweight positioning established earlier in the year as investors anticipated an impact on yields from stronger growth, QE tapering…and looking ahead to Fed rate hikes that certainly hasn’t happened to this point.” Bond on both sides of the Atlantic also seem to be affected by recent comments by officials, including former Fed Chairman Ben Bernanke, that the terminal level of policy rates when policy is finally normalized is likely to be well below the historical average. European bonds have been rallying on expectations of further ECB easing, and with US yields higher than Bunds, they remain attractive to foreign investors. Finally, looking at the decline in Treasury yields as US stocks extend their rally into record territory, the US markets may be forecasting a Goldilocks scenario of strong yet non-inflationary growth. It’s possible. Japanese 10-year yields haven’t been above 2% since February 1999.
In any event, the dollar continued its gains overnight, rising against all the G10 currencies except JPY and AUD (see below). EUR/USD broke below the 1.3612 level that has provided support until now, which suggests that USD is likely to continue to gain (see technical comment below). It even gained vs GBP despite comments by Martin Weale, an external member of the Bank of England’s Monetary Policy Committee (MPC), in a Financial Times interview that rates would have to start rising earlier than expected and could rise by up to one percentage point a year, faster than the market currently anticipates. The failure of GBP to respond to these comments suggests sentiment towards the pound has changed significantly. The technical picture has also turned poor (see below). I am becoming more cautious on the currency.
Overnight news: Overnight Japan announced that retail sales for April fell at a record 13.7% mom, exceeding market estimates (guesses, really) of an 11.7% mom decline. Nobody really had any idea how much demand would fall off after the consumer splurge in March, ahead of the April 1st hike in the consumption tax. Now we will be waiting to see how long it takes for demand to bounce back to normal. One might have thought that the larger-than-expected decline would depress the yen as it makes further BoJ easing marginally more likely, but the currency was strengthening before the news and didn’t really react to the report.
Australia’s private capital expenditure fell 4.2% qoq in Q1, far more than the -1.5% the market expected, but the market focused instead on the forward-looking news, the spending plans for FY14/15. These showed a rise of AUD 12.2bn from the previous estimate to AUD 137.1bn, “well above” expectations. The key point was that this rise was due to increased investment intentions of the services sector, suggesting that other industries may be able to take over from the mining industry as the engine of growth for the Australian economy.
Today’s indicators: There are no major European indicators coming out today. On the other hand, there are several important US indicators coming out. The second estimate of the nation’s GDP for Q1 is forecast to show a 0.5% qoq SAAR decline after the initial estimate of +0.1% qoq SAAR growth. The contraction in output will probably be attributed to cold weather. The slowdown to +0.1% qoq SAAR growth caused the dollar to weaken somewhat, so news of a contraction could have an even bigger impact, but on the other hand, the second estimate of GDP usually does not have as strong an impact as the initial impact, since by this time Q1 ended almost two months ago and the Q2 data has been shaping up fairly well. Initial jobless claims for the week ended on May 24 are estimated to have declined to 318k from 326k the previous week, bringing the 4wk moving average down to 316k from 322.5k. Finally, pending home sales for April are expected to slow.
As for speakers, Cleveland Fed President Sandra Pianalto gives welcoming remarks at a conference entitled “Inflation, Monetary policy and the Public”.
The Market
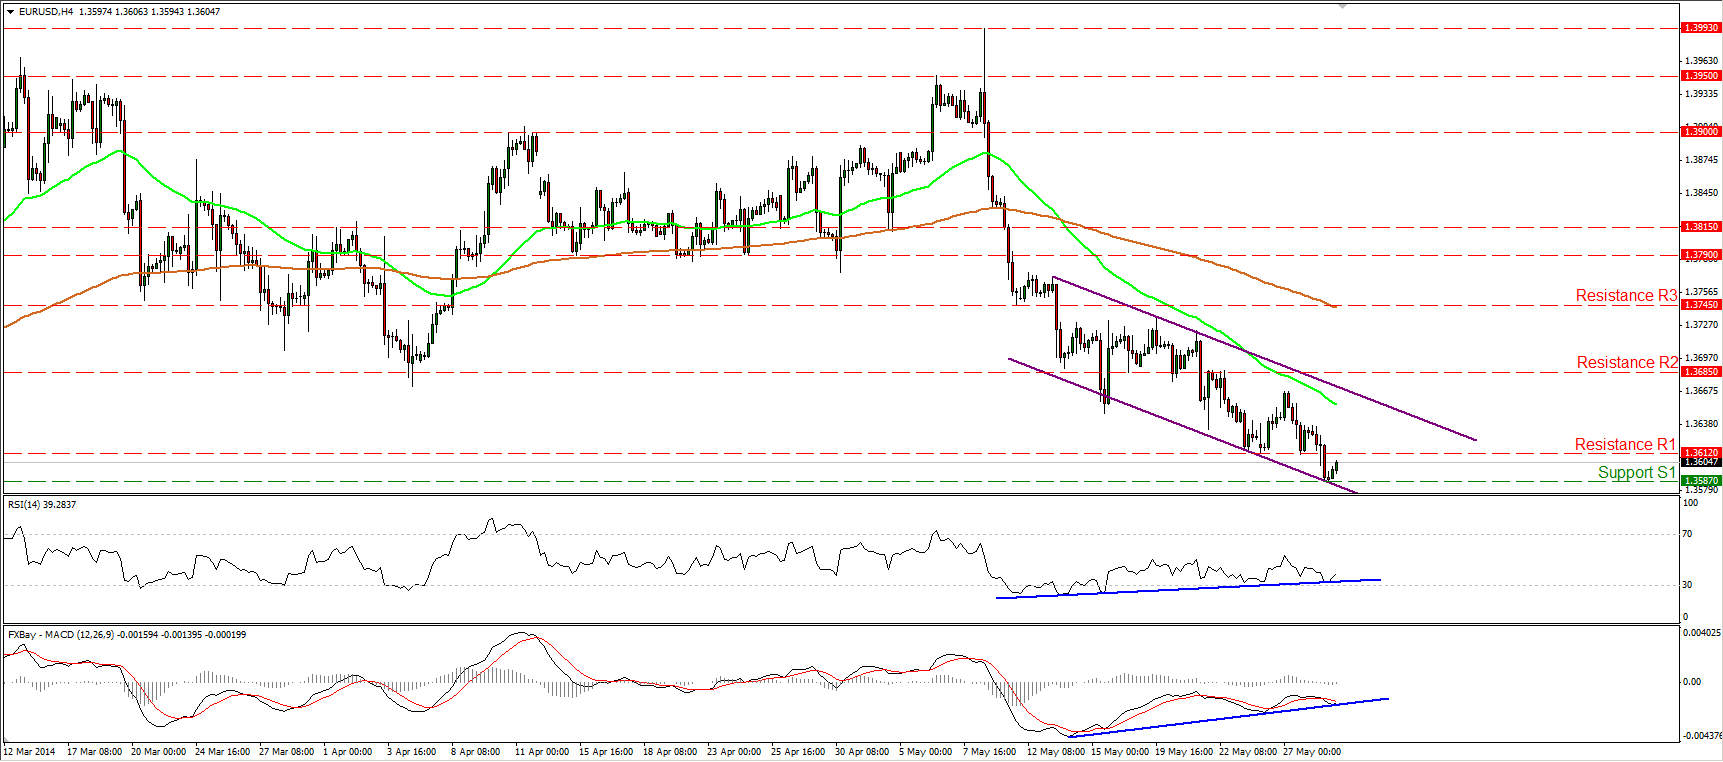
EUR/USD breaks the 1.3612 hurdle
EUR/USD fell below the 1.3612 barrier to meet support at 1.3587 (S1). I would expect the dip below the 1.3612 barrier to have larger bearish implications and open the way for the lows of February at 1.3475 (S2). As long as the rate is printing lower highs and lower lows within the purple downtrend channel and below both the moving averages, the outlook remains to the downside. Nonetheless, the positive divergence between our momentum studies and the price action remains in effect, thus I still cannot rule out an upside corrective wave within the channel. On the daily chart, yesterday’s candle closed below the 200-day moving average, increasing the possibilities for the continuation of the downtrend.
• Support: 1.3587 (S1), 1.3475 (S2), 1.3400 (S3).
• Resistance: 1.3612 (R1), 1.3685 (R2), 1.3745 (R3).
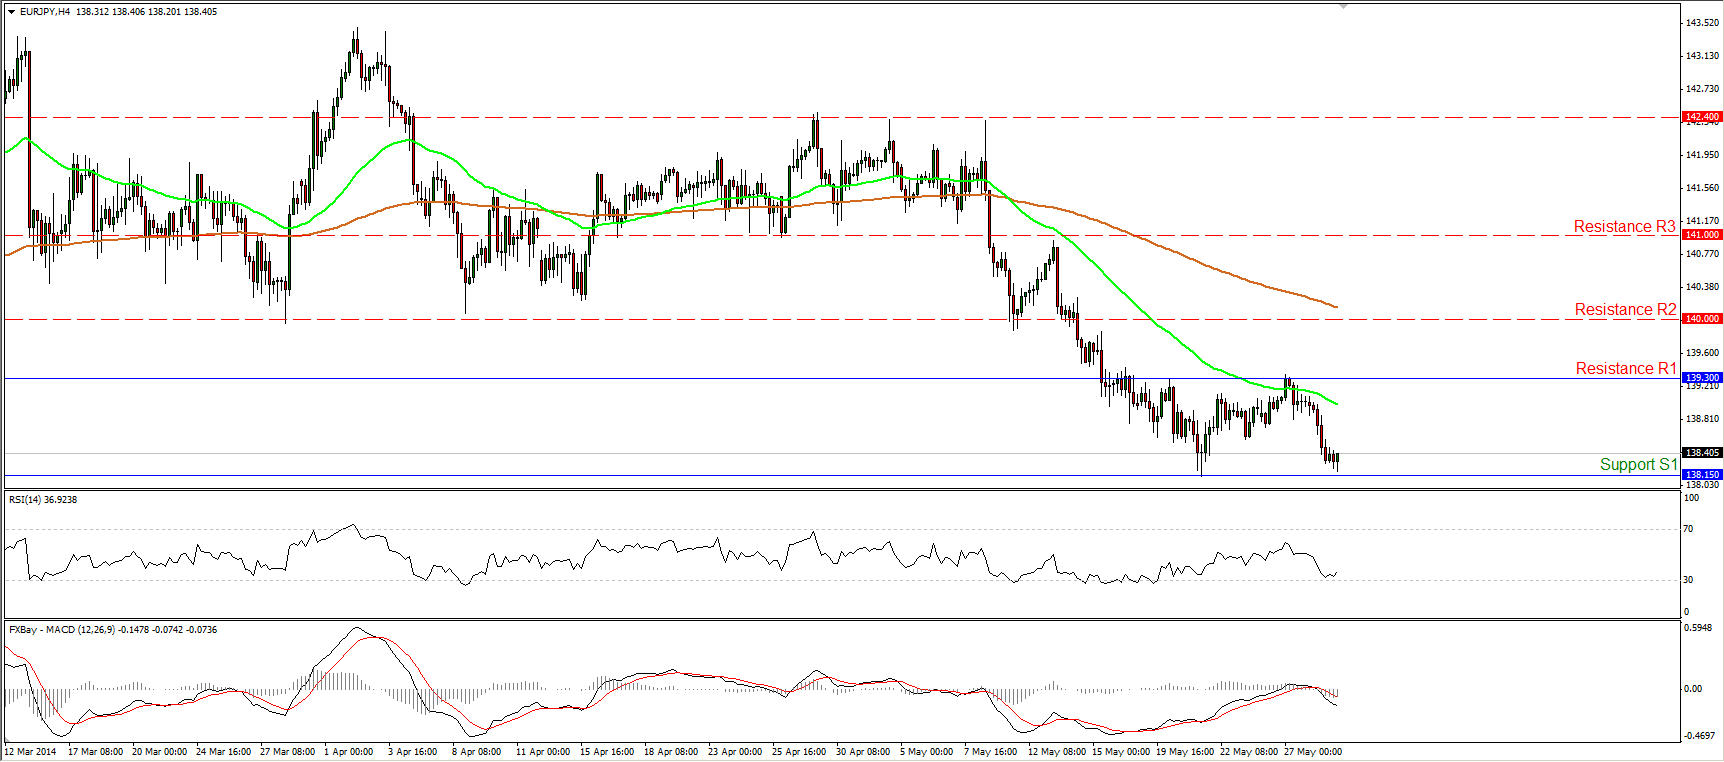
EUR/JPY declines after hitting 139.30
EUR/JPY declined after finding strong resistance at 139.30 (R1) and is now trading near the support of 138.15 (S1). The rate seems to follow a sideways path between the two aforementioned barriers and a rebound near the 138.15 (S1) zone may see the resistance of 139.30 (R1) again. Relying on our momentum studies does not seem a solid strategy, since the MACD lies below both its trigger and zero lines, while the RSI found support near its 30 level and is now pointing up.
• Support: 138.15 (S1), 137.55 (S2), 136.20 (S3)
• Resistance: 139.30 (R1), 140.00 (R2), 141.00 (R3).
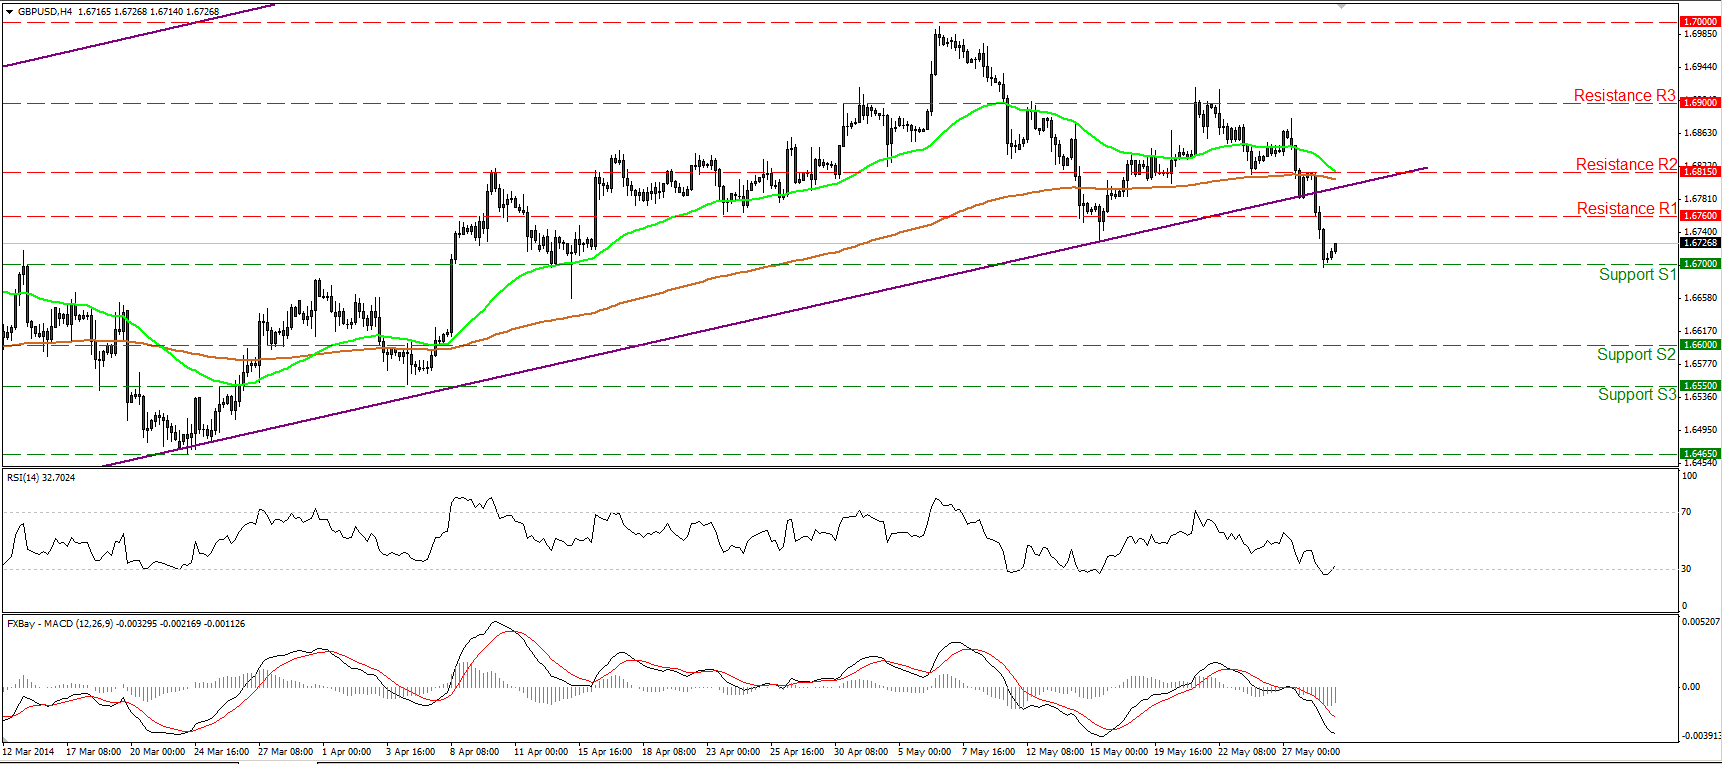
GBP/USD breaks below the long-term uptrend channel
GBP/USD fell below the lower boundary of the long-term uptrend channel but the decline was halted at 1.6700 (S1). The near-term picture has now turned negative and a dip below the 1.6700 (S1) key hurdle could see the 1.6600 (S2) zone. The 50-period moving average is getting closer to the 200-period average and a bearish cross in the near future will be an additional negative sign for the currency pair. The MACD lies below both its trigger and zero lines, confirming the recent bearish momentum, but the RSI exited its oversold zone, thus an upside corrective wave is likely before the bears prevail again.
• Support: 1.6700 (S1), 1.6600 (S2), 1.6550 (S3).
• Resistance: 1.6760 (R1), 1.6815 (R2), 1.6900 (R3).
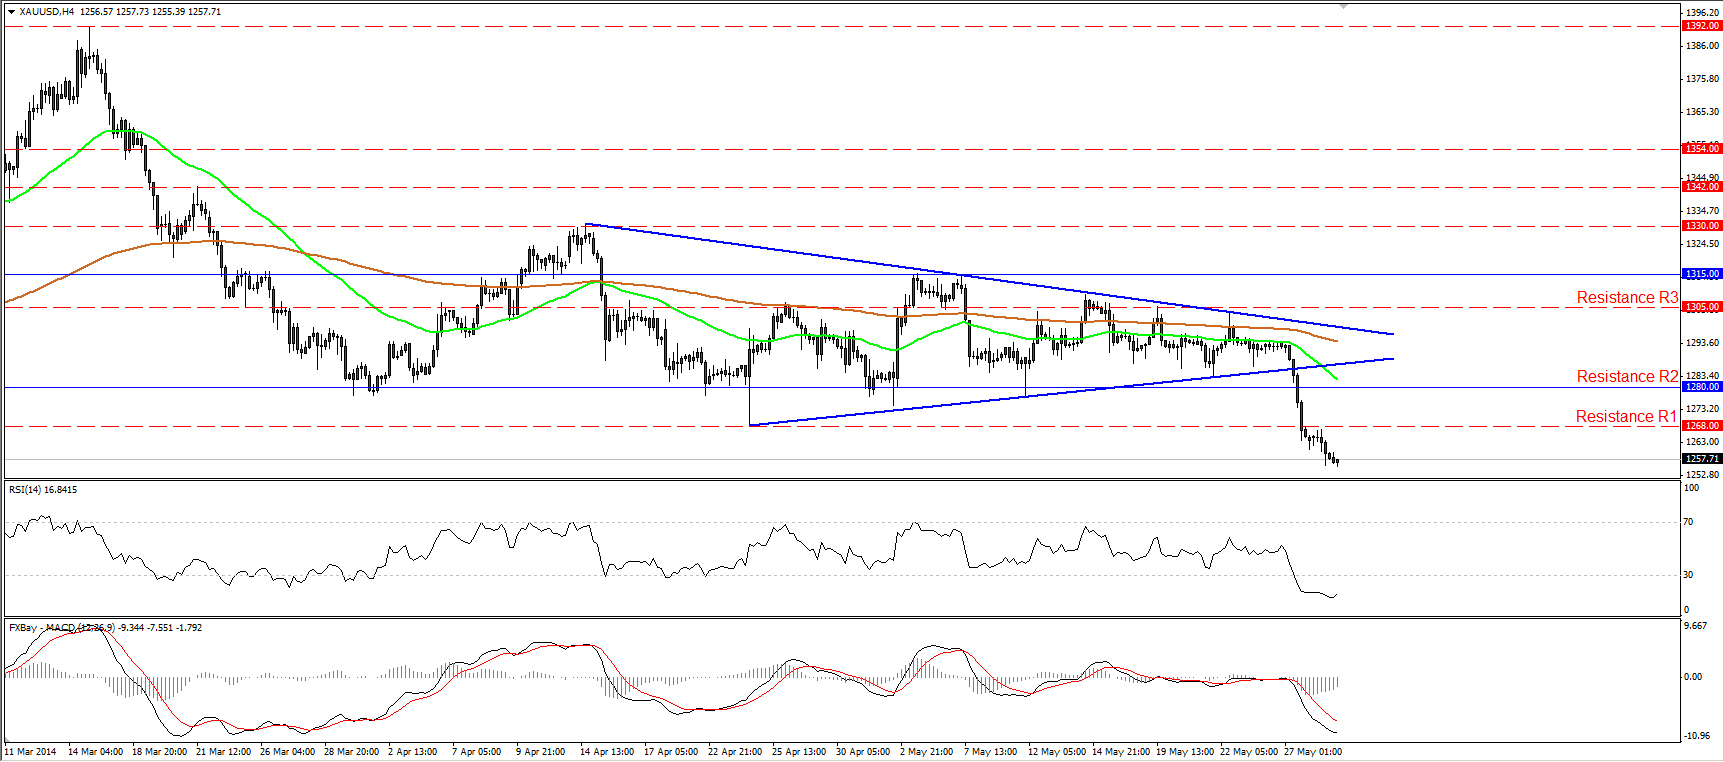
Gold continues falling
Gold continued its plunge after the exit from the triangle formation. The yellow metal moved further below 1268 (R1) level and I still expect it to challenge the 1250 (S1) support. If the bears are willing the push the price below that hurdle, they may see as a target the next support at 1235 (S2), slightly above the 161.8% extension level of the formation’s width. Zooming in on the 1-hour chart, we can identify positive divergence between our hourly momentum studies and the price action, thus a pull-up before the continuation of the decline seems likely.
• Support: 1250 (S1), 1235 (S2), 1218 (S3).
• Resistance: 1268 (R1), 1280 (R2), 1305 (R3)
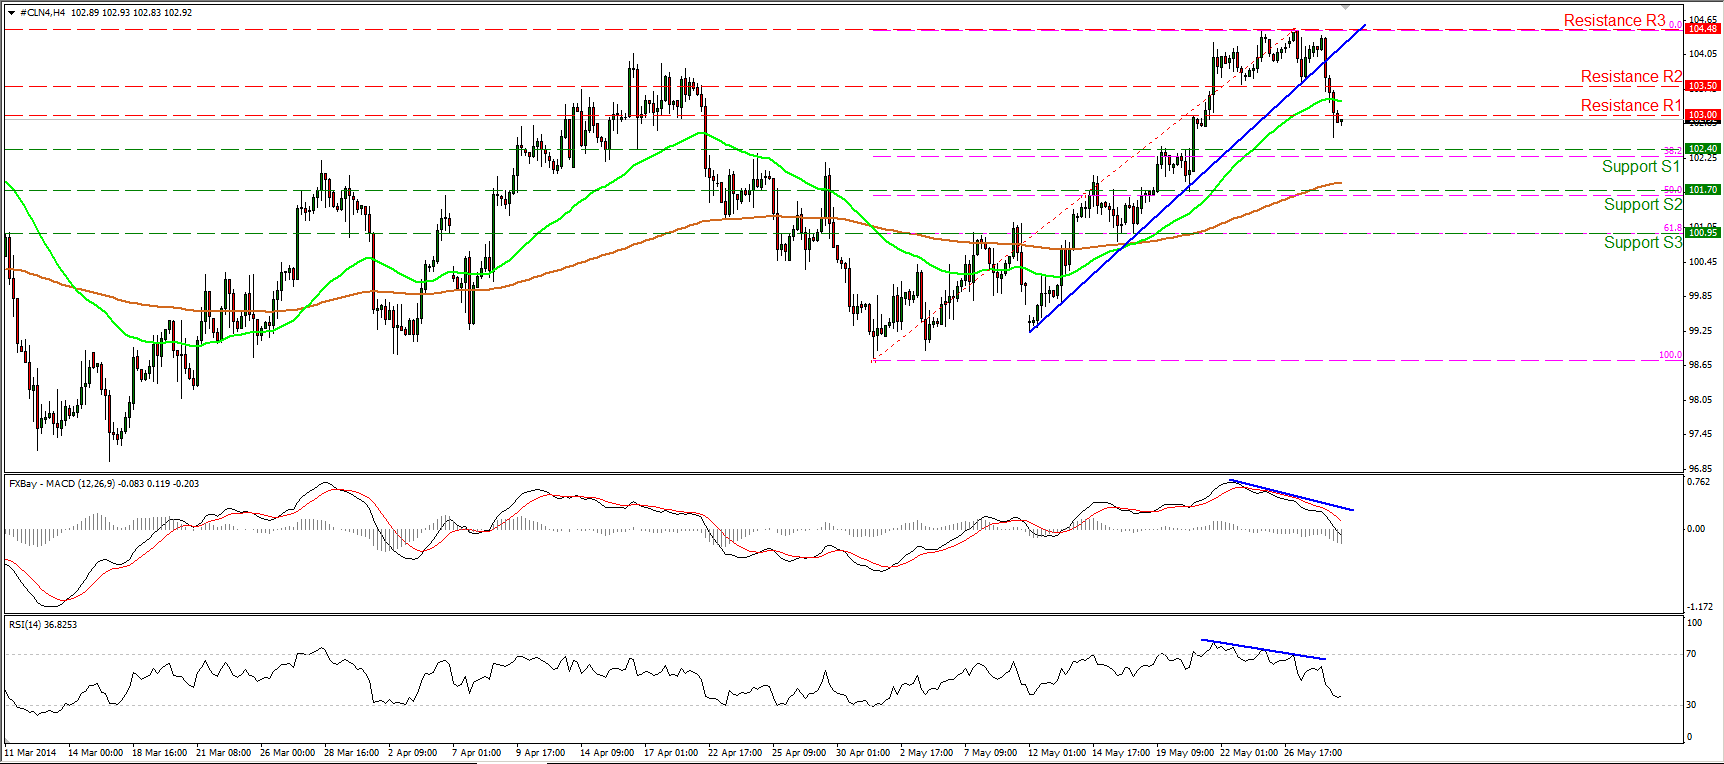
WTI confirms the weakness signs
WTI fell below the short term blue uptrend line and the 103.50 barrier, completing a failure swing top and turning the picture negative. The decline confirms the negative divergence between our momentum studies and the price action. During the early European morning, the price is trading below the 103.00 (R1) barrier and I would expect the decline to continue and challenge the 102.40 zone, near the 38.2% retracement level of the prevailing advance. On the daily chart, yesterday’s candle confirmed Tuesday’s candle which looks like a hanging man, thus I would expect the decline to continue.
• Support: 102.40 (S1), 101.70 (S2), 100.95 (S3)
• Resistance: 103.00 (R1), 103.50 (R2), 104.48 (R3).

